Learn About The Law
Get help with your legal needs
FindLaw’s Learn About the Law features thousands of informational articles to help you understand your options. And if you’re ready to hire an attorney, find one in your area who can help.
Current as of January 02, 2025 | Updated by Findlaw Staff
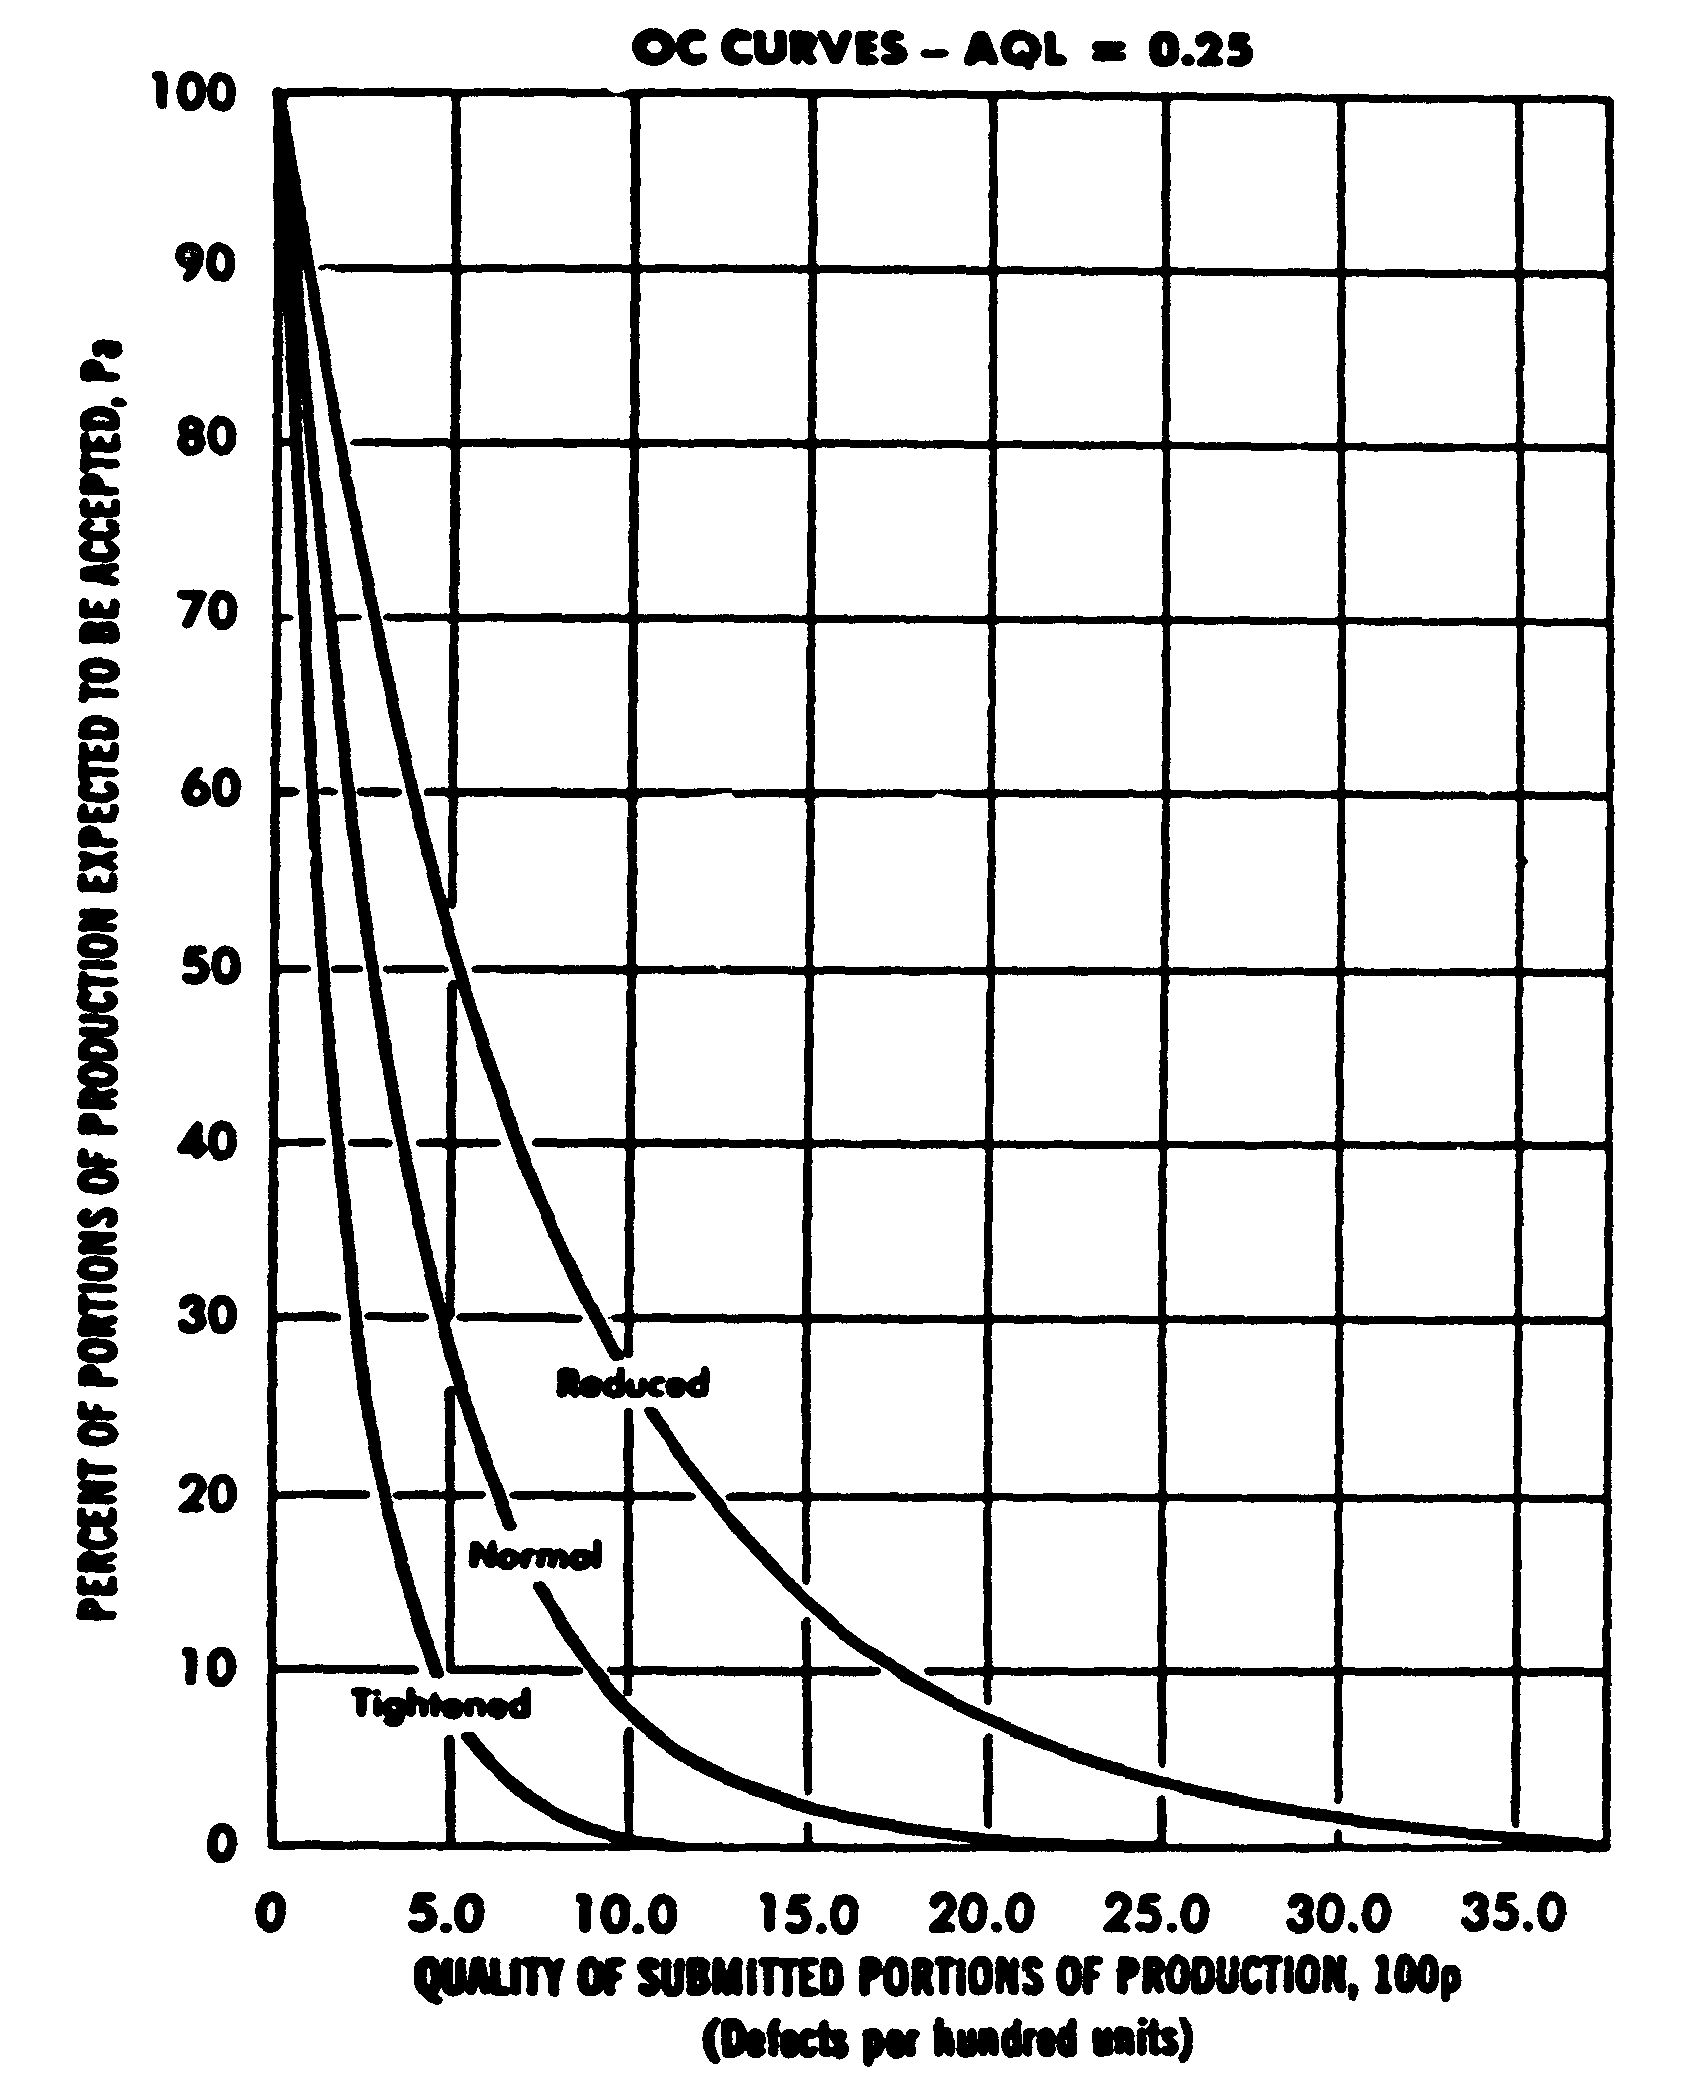
(a) This section contains the Operating Characteristic (OC) curve for each of the on-line cumulative sum sampling plans provided in subpart D. The OC curve and the corresponding cumulative sum sampling plans are listed by AQL.
(b) Different plan parameters used to make acceptance and rejection decisions are provided for each AQL.
(c) The curves show the ability of the various cumulative sum sampling plans to distinguish between good and bad portions of production. The interpretation of these curves for portions of production is similar to the interpretation of the OC curves for stationary lots as illustrated in § 42.140(c).
|
REDUCED, NORMAL AND TIGHTENED INSPECTION PLANS—CUMULATIVE SUM SAMPLING PLANS AND OPERATING CHARACTERISTIC (OC) CURVES FOR AQL = 0.25 DEFECTS PER HUNDRED UNITS |
|||||||||||
|---|---|---|---|---|---|---|---|---|---|---|---|
|
[Sampling plans—AQL = 0.25] |
|||||||||||
|
Identification name of OC curves |
|||||||||||
|
Reduced |
Normal |
Tightened |
|||||||||
|
ng |
T |
L |
S |
ng |
T |
L |
S |
ng |
T |
L |
S |
|
13 |
0 |
0 |
0 |
25 |
0.05 |
0.95 |
0.35 |
50 |
0.1 |
0.9 |
0.3 |
|
ng = Number of sample units in a subgroup. T = Subgroup tolerance. L = Acceptance limit. S = Starting value. |
|
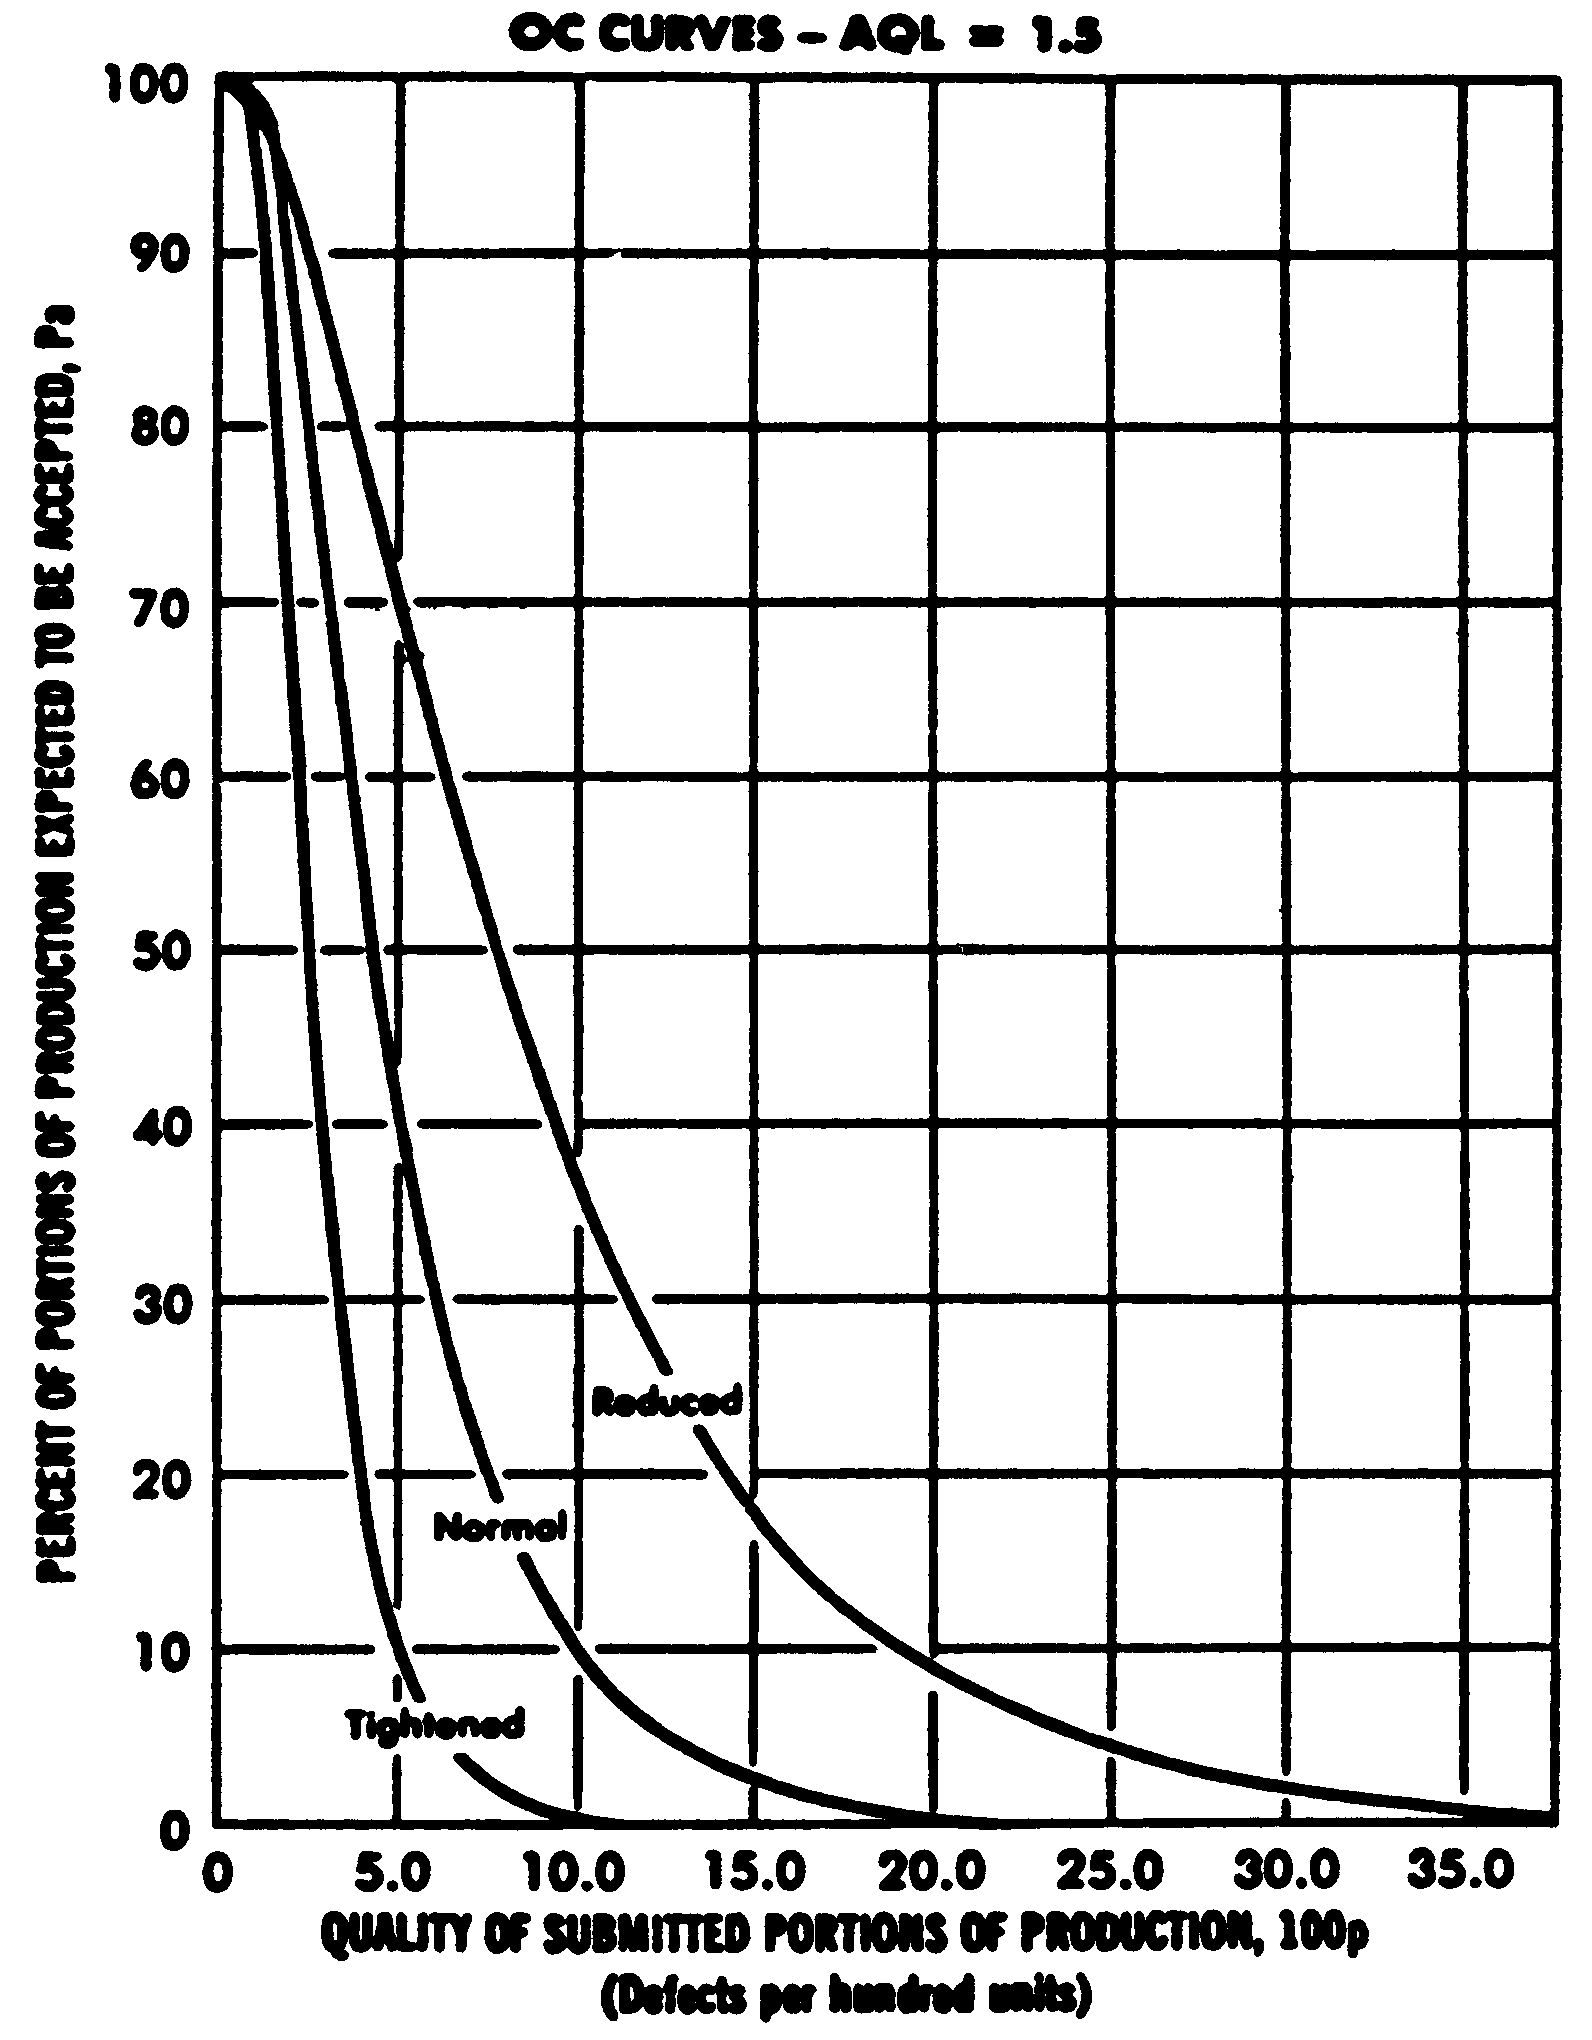
REDUCED, NORMAL, AND TIGHTENED INSPECTION PLANS—CUMULATIVE SUM SAMPLING PLANS AND OPERATING CHARACTERISTIC (OC) CURVES FOR AQL = 1.5 DEFECTS PER HUNDRED UNITS |
|||||||||||
|---|---|---|---|---|---|---|---|---|---|---|---|
|
[Sampling plans—AQL = 1.5] |
|||||||||||
|
Identification name of OC curves |
|||||||||||
|
Reduced |
Normal |
Tightened |
|||||||||
|
ng |
T |
L |
S |
ng |
T |
L |
S |
ng |
T |
L |
S |
|
13 |
0.5 |
0.5 |
0 |
25 |
0.5 |
2 |
1 |
50 |
0.8 |
1.6 |
0.4 |
|
ng = Number of sample units in a subgroup. T = Subgroup tolerance. L = Acceptance limit. S = Starting value. |
|
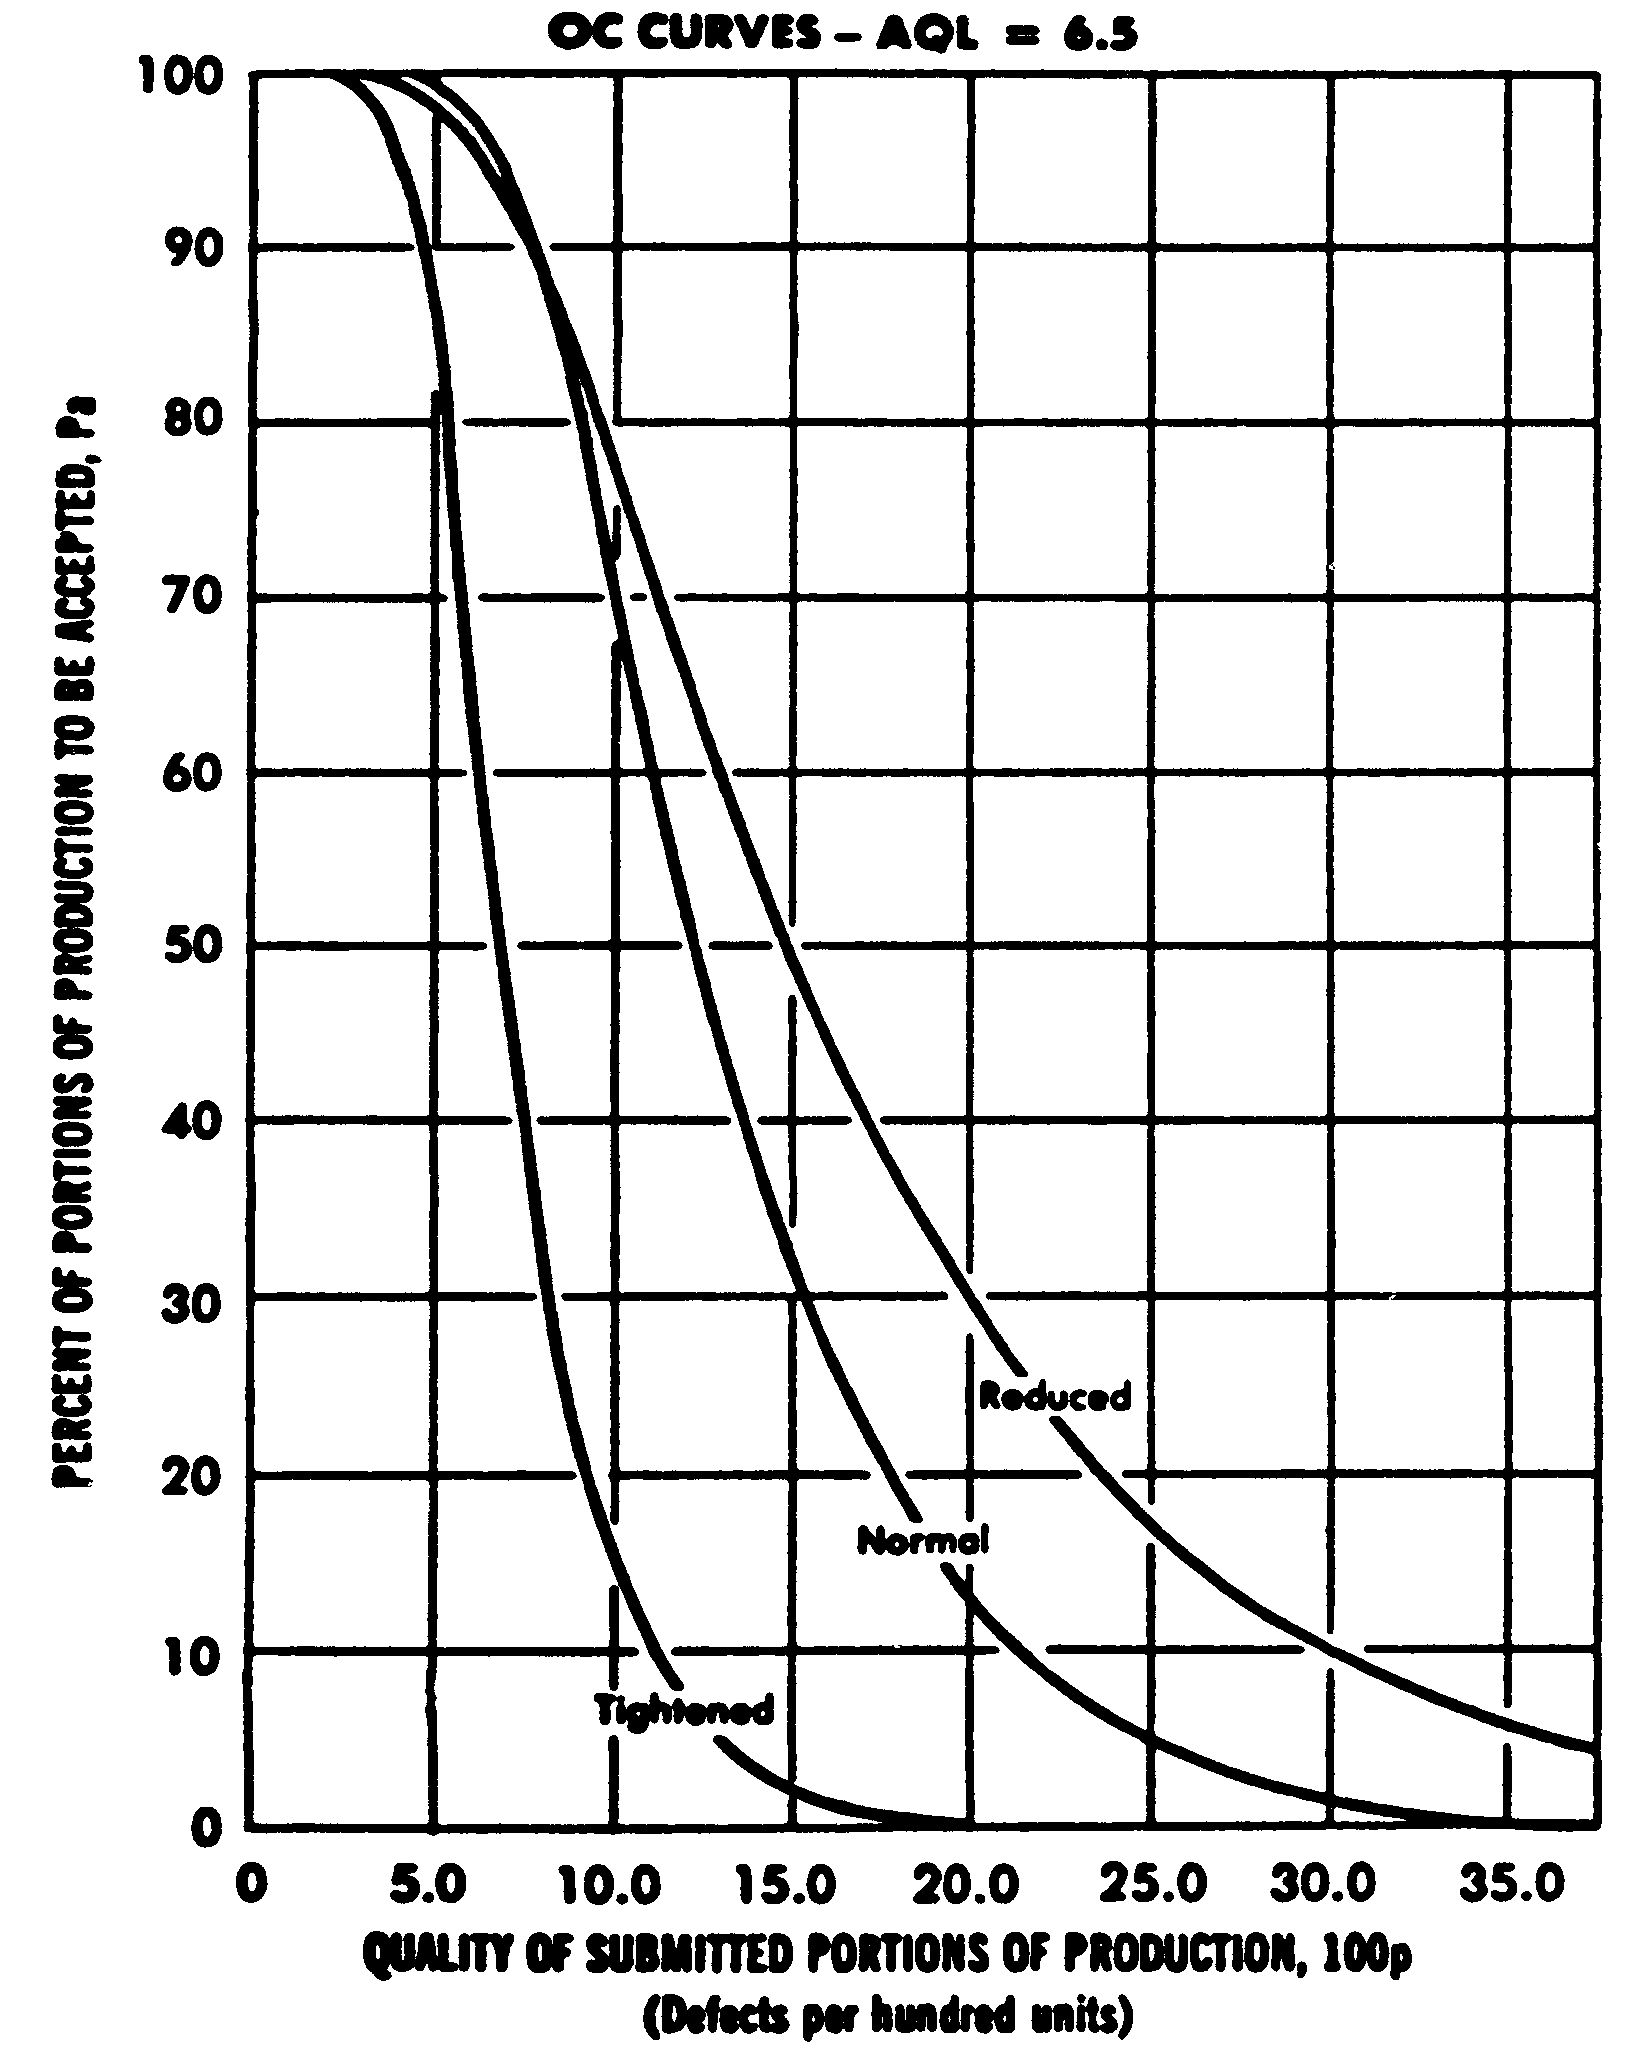
REDUCED, NORMAL, AND TIGHTENED INSPECTION PLANS—CUMULATIVE SAMPLING PLANS AND OPERATING CHARACTERISTIC (OC) CURVES FOR AQL = 6.5 DEFECTS PER HUNDRED UNITS |
|||||||||||
|---|---|---|---|---|---|---|---|---|---|---|---|
|
[Sampling Plans—AQL = 6.5] |
|||||||||||
|
Identification name of OC curves |
|||||||||||
|
Reduced |
Normal |
Tightened |
|||||||||
|
ng |
T |
L |
S |
ng |
T |
L |
S |
ng |
T |
L |
S |
|
13 |
1 |
2 |
1 |
25 |
2 |
3 |
1 |
50 |
2.5 |
3 |
1 |
|
ng = Number of sample units in a subgroup. T = Subgroup tolerance. L = Acceptance limit. S = Starting value. |
Cite this article: FindLaw.com - Code of Federal Regulations Title 7. Agriculture § 7.42.143 Operating Characteristic (OC) curves for on-line sampling and inspection - last updated January 02, 2025 | https://codes.findlaw.com/cfr/title-7-agriculture/cfr-sect-7-42-143/
FindLaw Codes may not reflect the most recent version of the law in your jurisdiction. Please verify the status of the code you are researching with the state legislature before relying on it for your legal needs.
Get help with your legal needs
FindLaw’s Learn About the Law features thousands of informational articles to help you understand your options. And if you’re ready to hire an attorney, find one in your area who can help.
