Learn About The Law
Get help with your legal needs
FindLaw’s Learn About the Law features thousands of informational articles to help you understand your options. And if you’re ready to hire an attorney, find one in your area who can help.
Current as of January 02, 2025 | Updated by Findlaw Staff
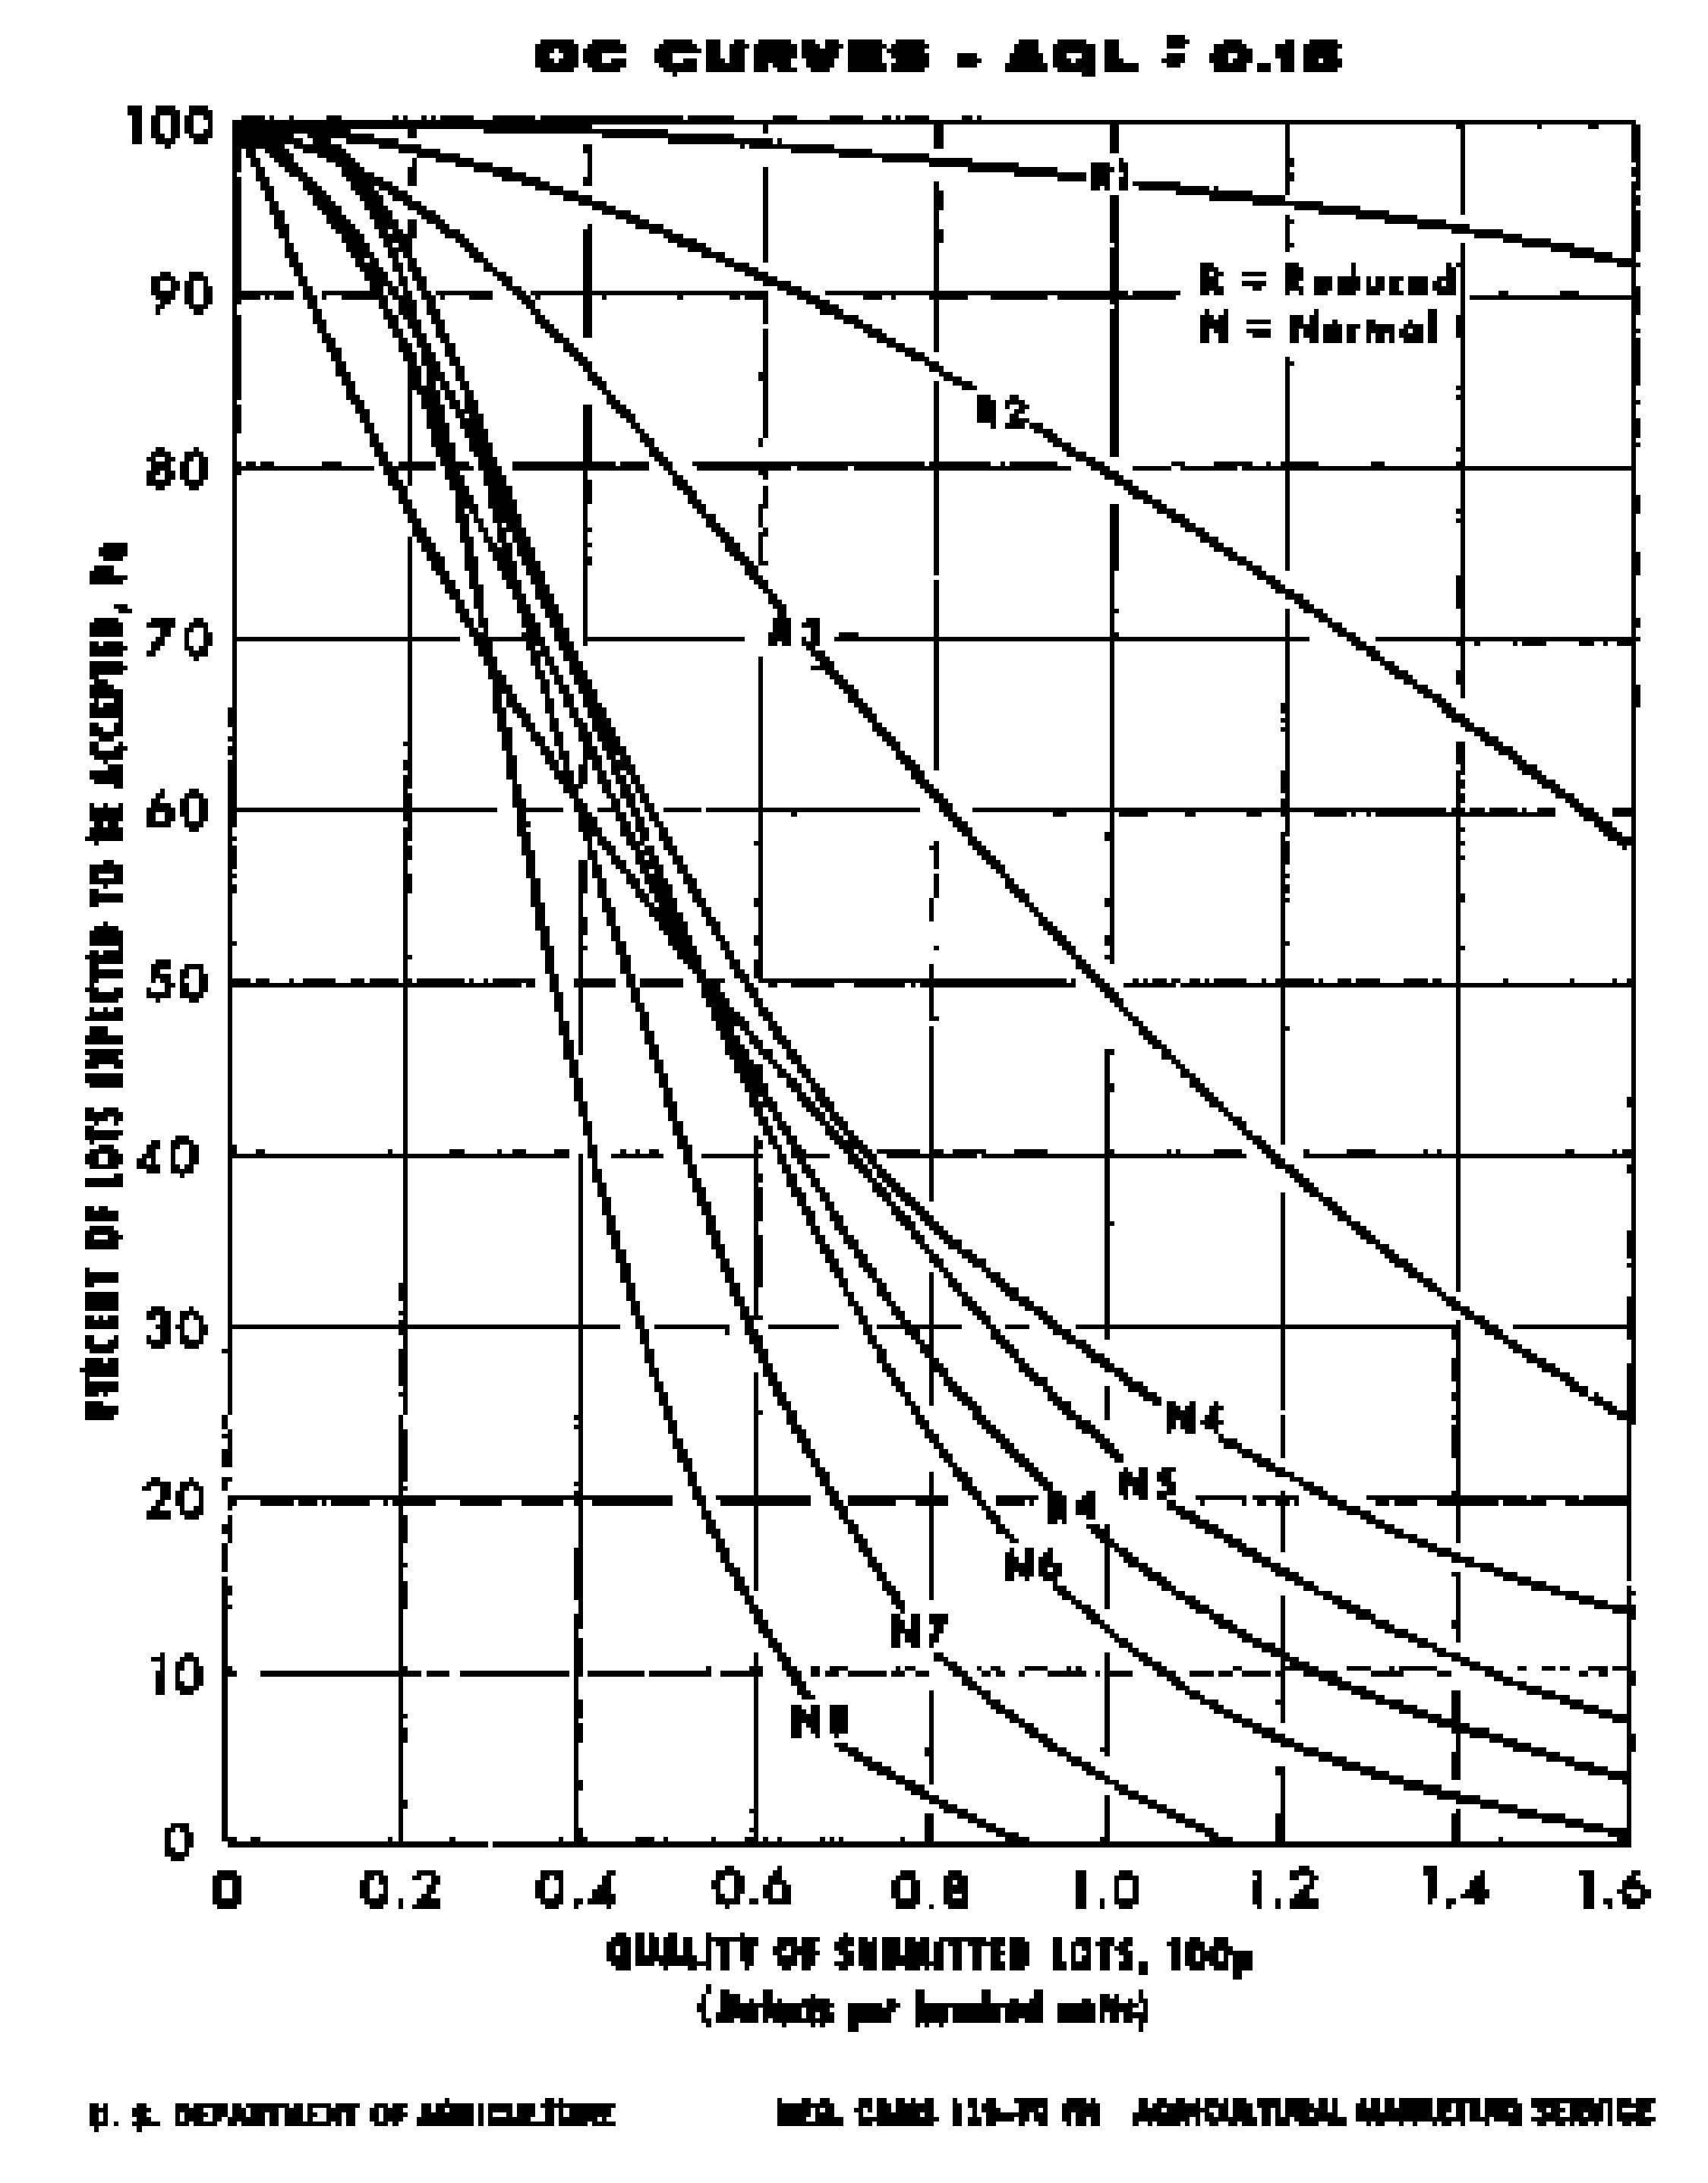
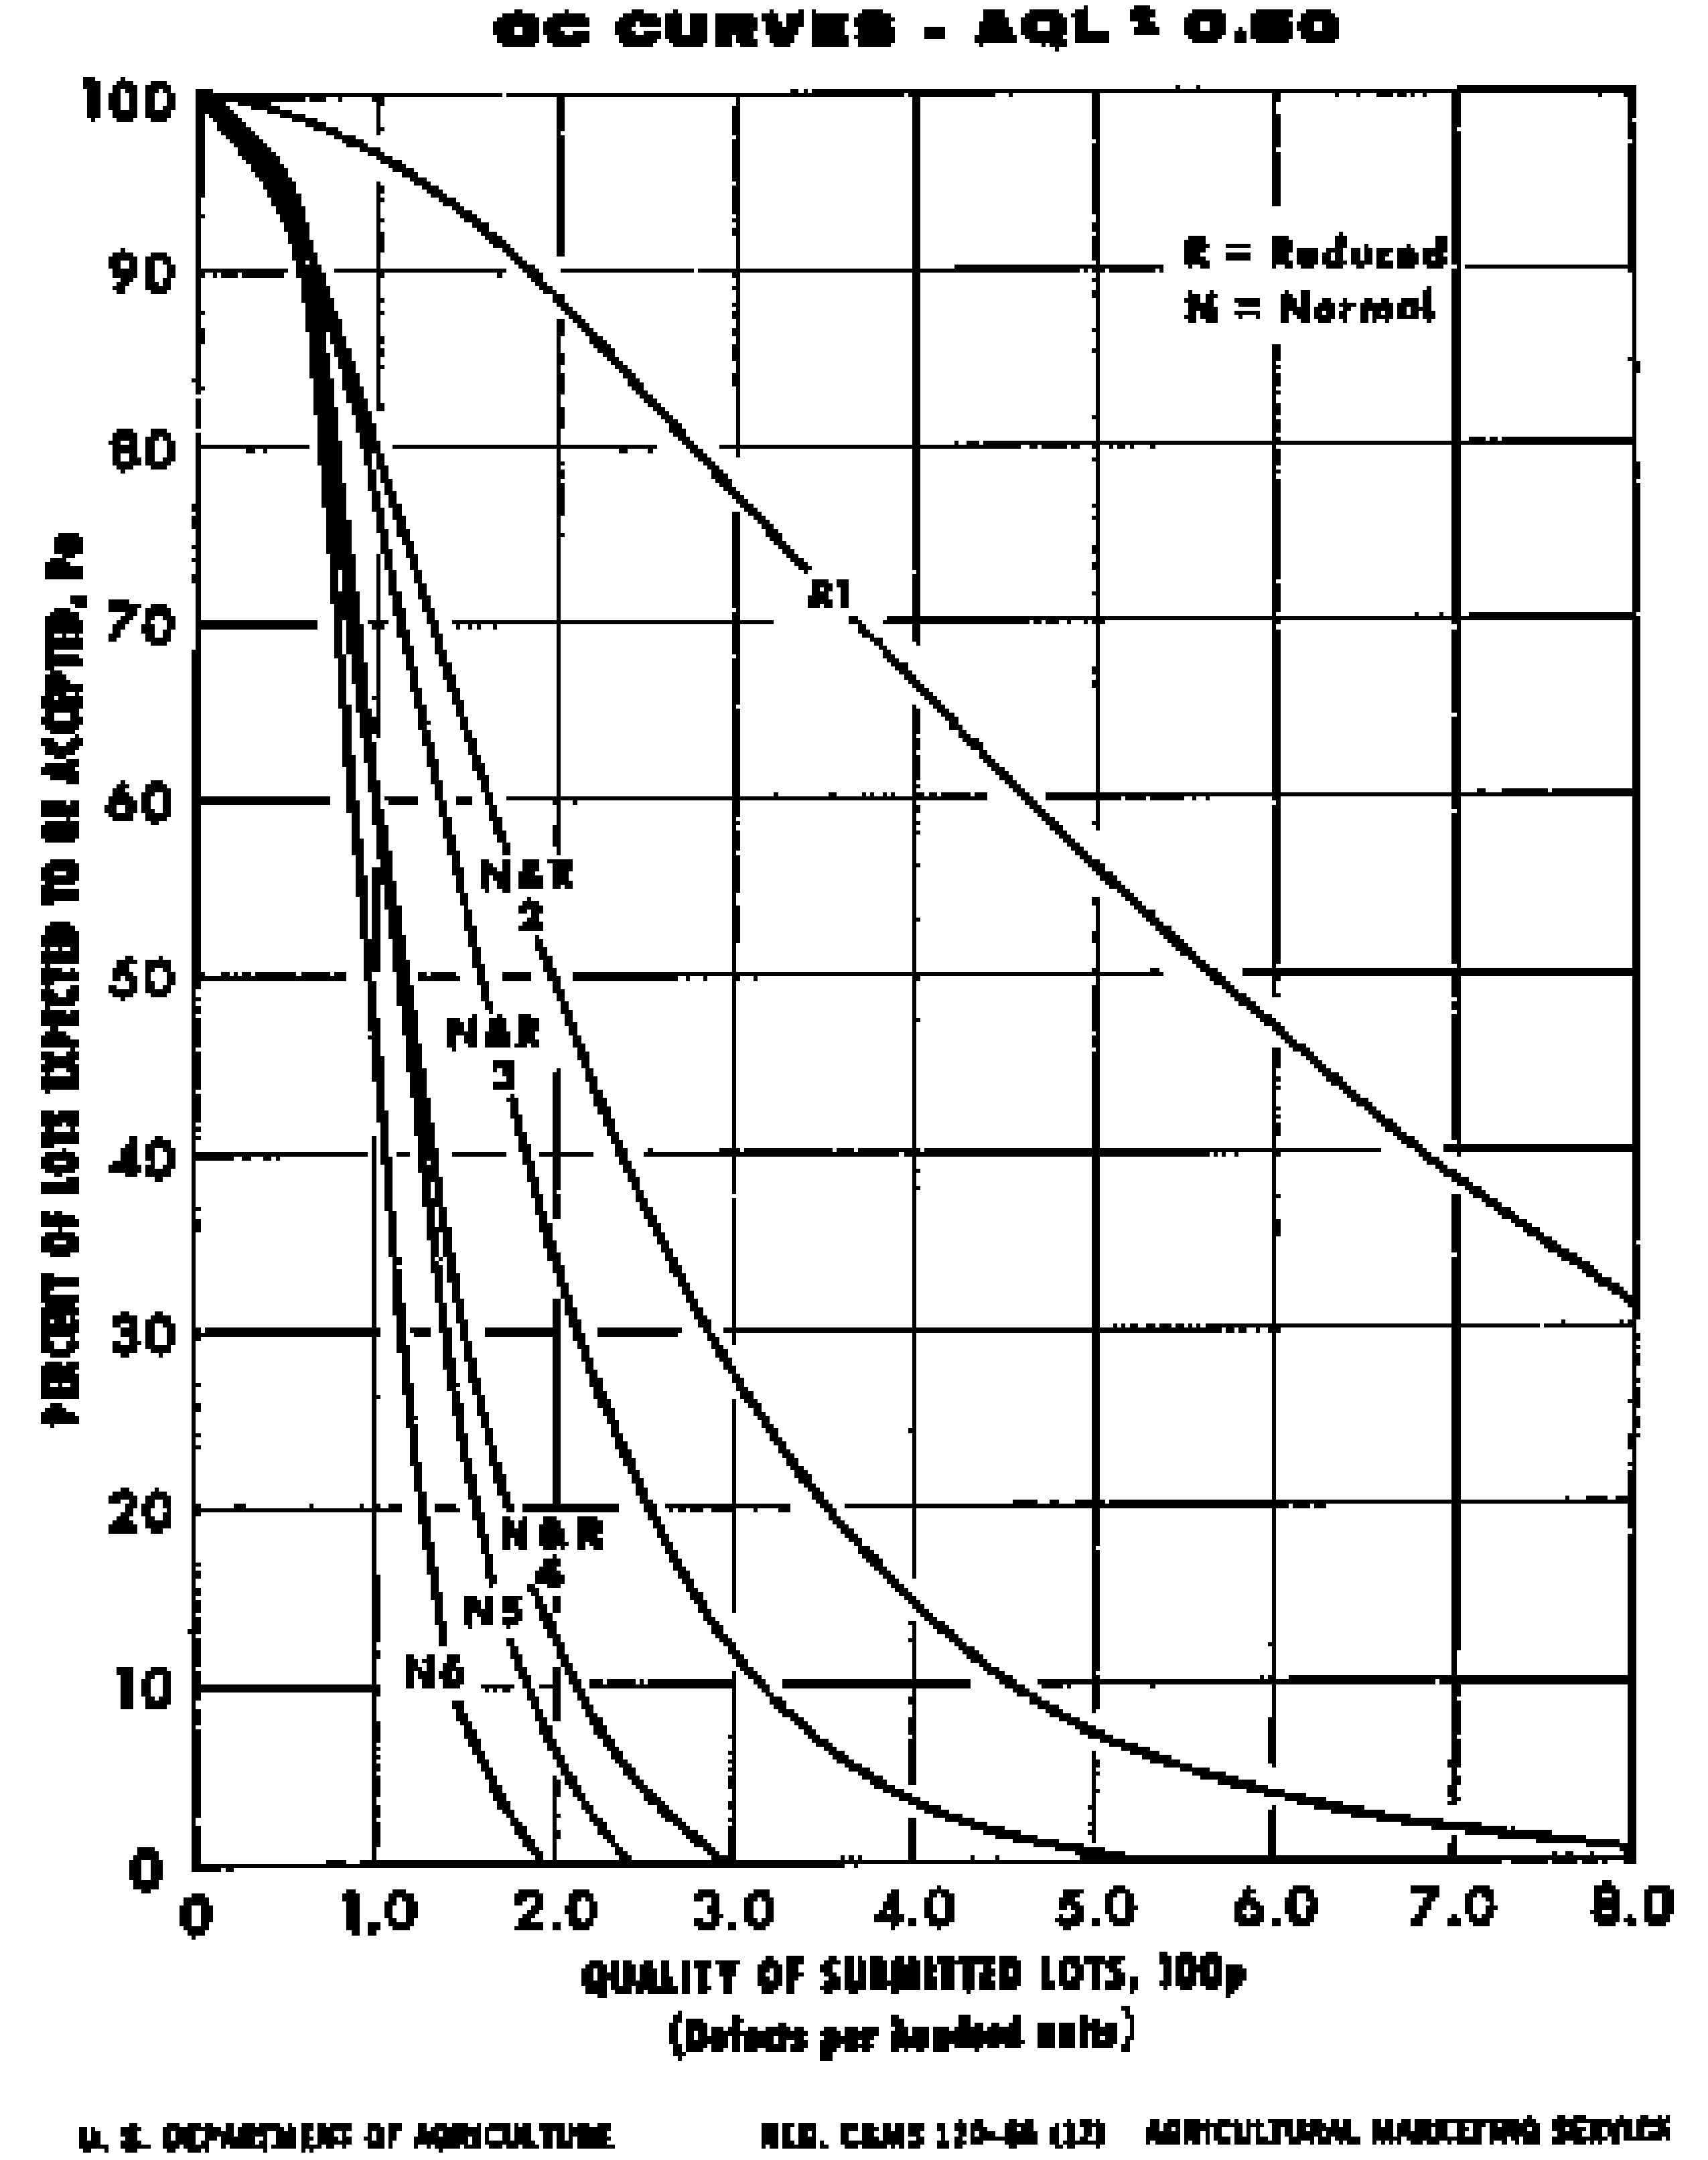
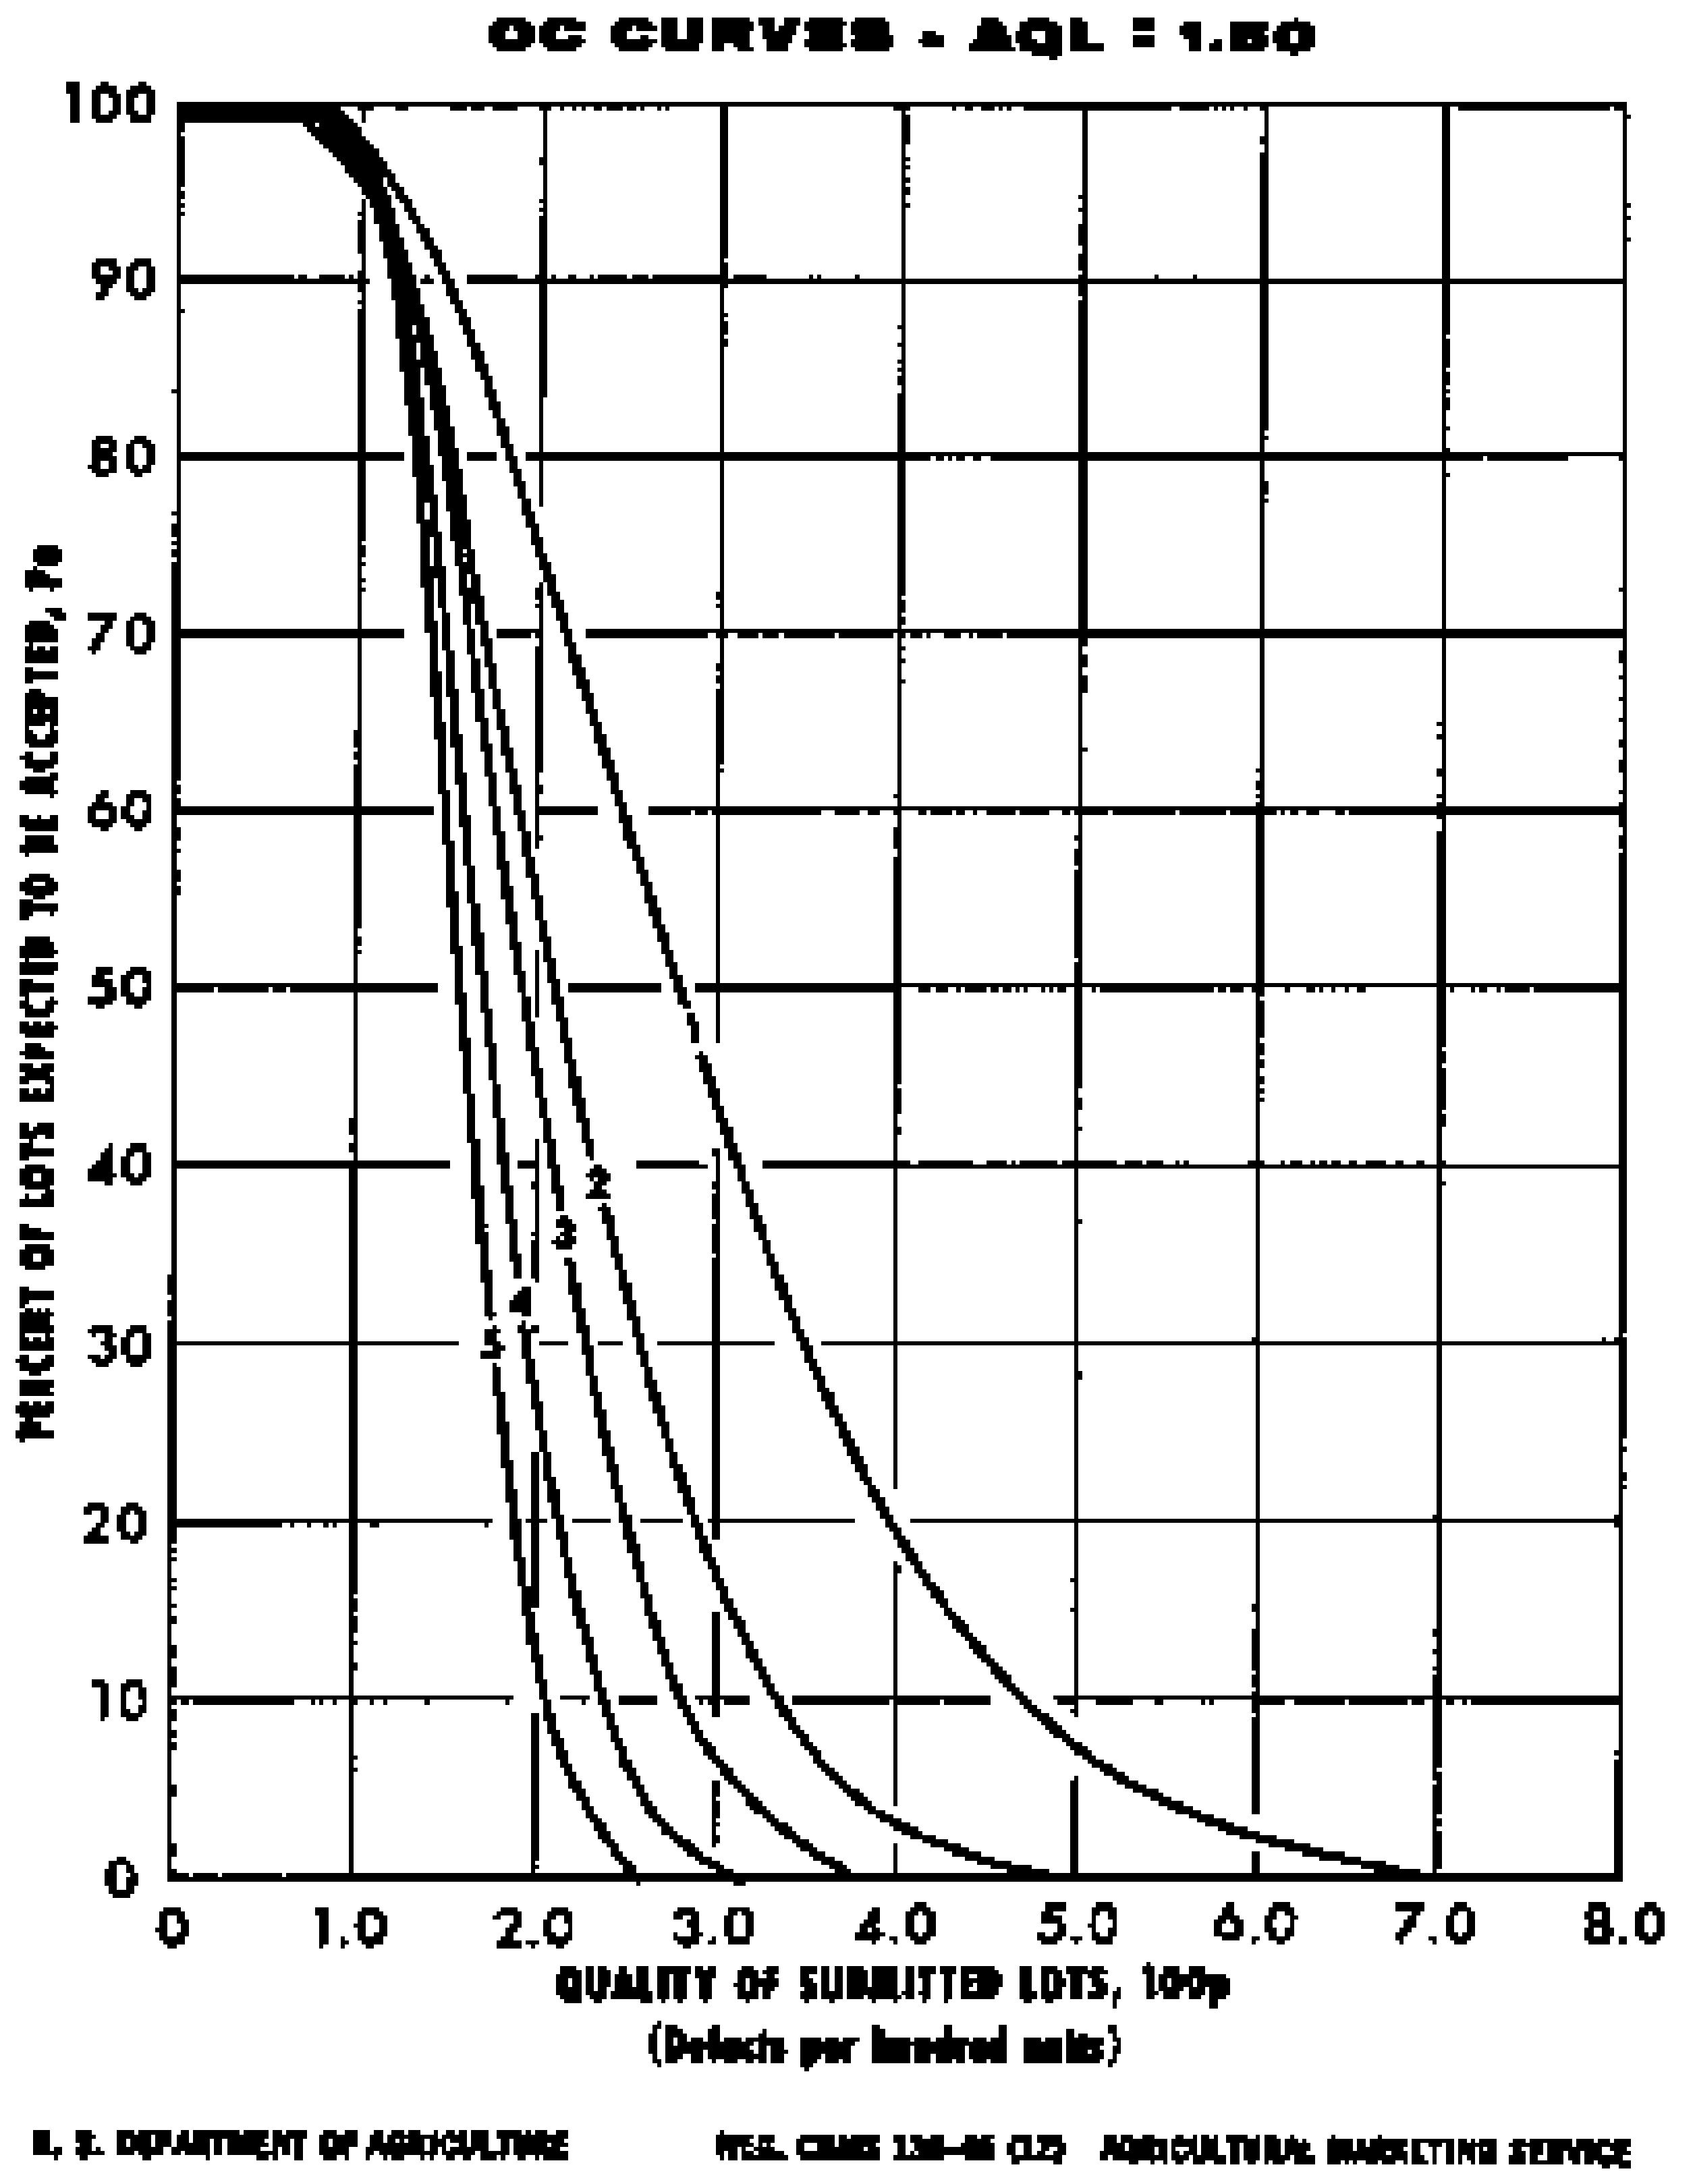
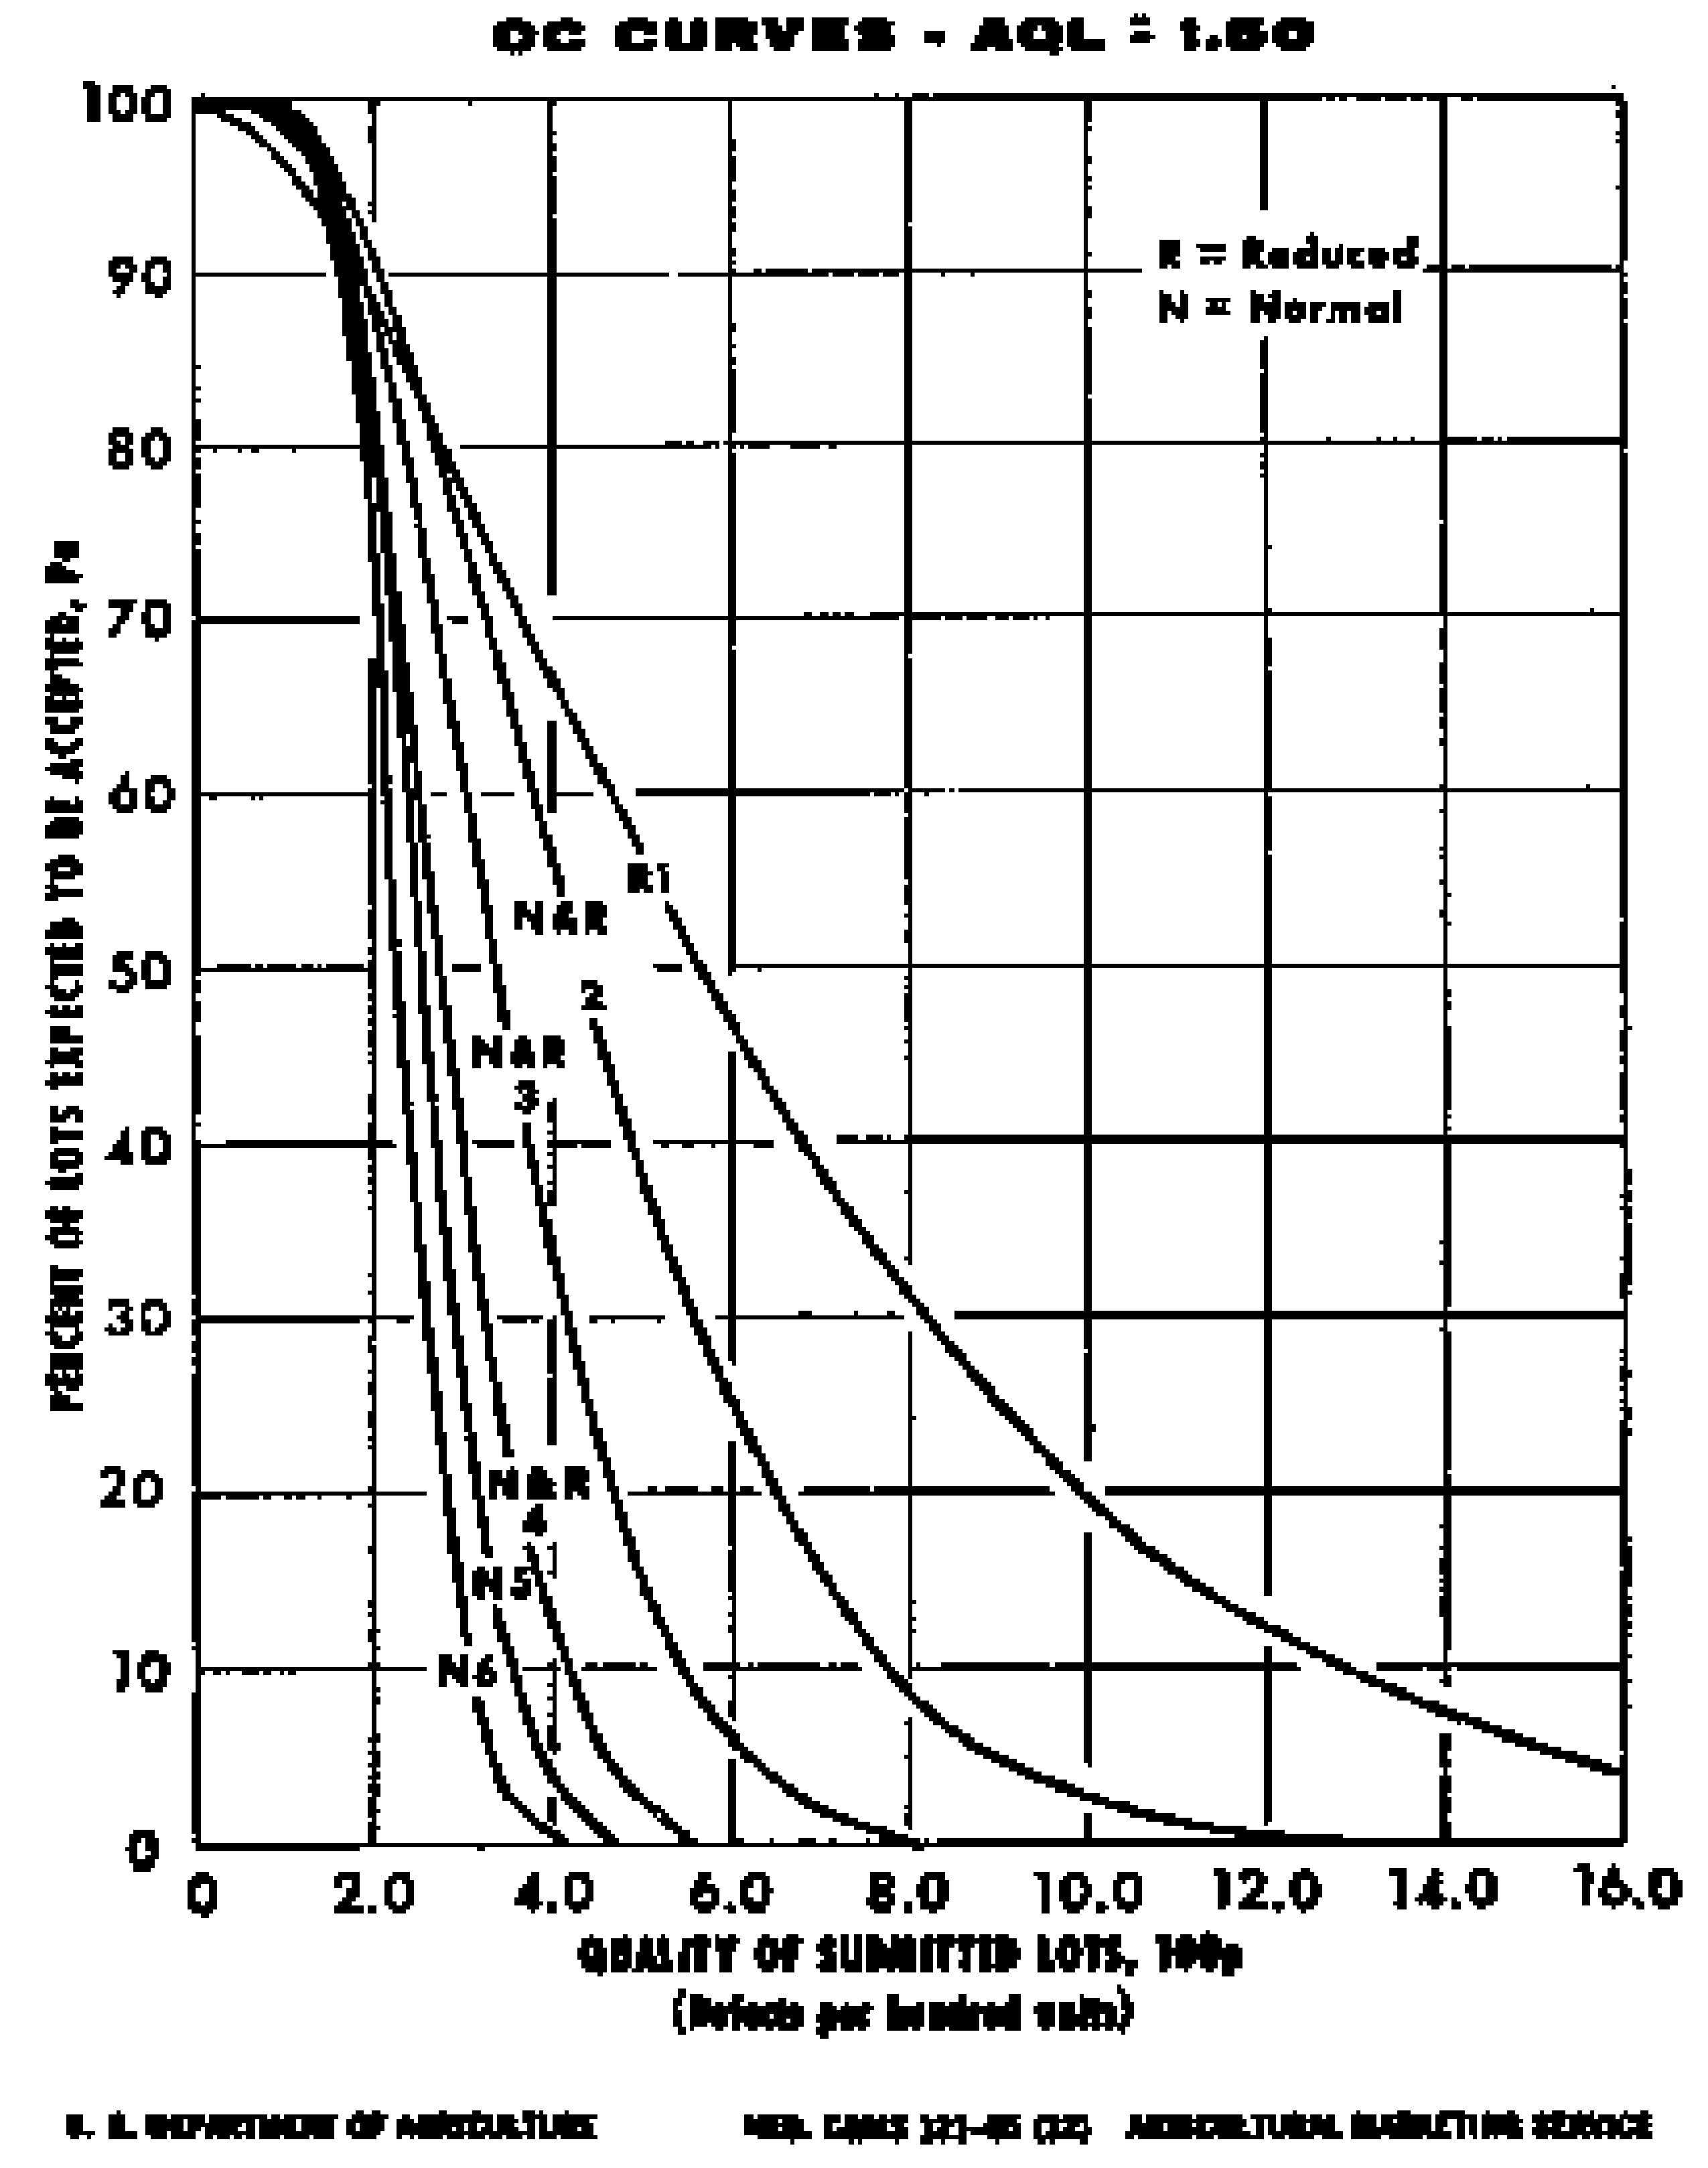
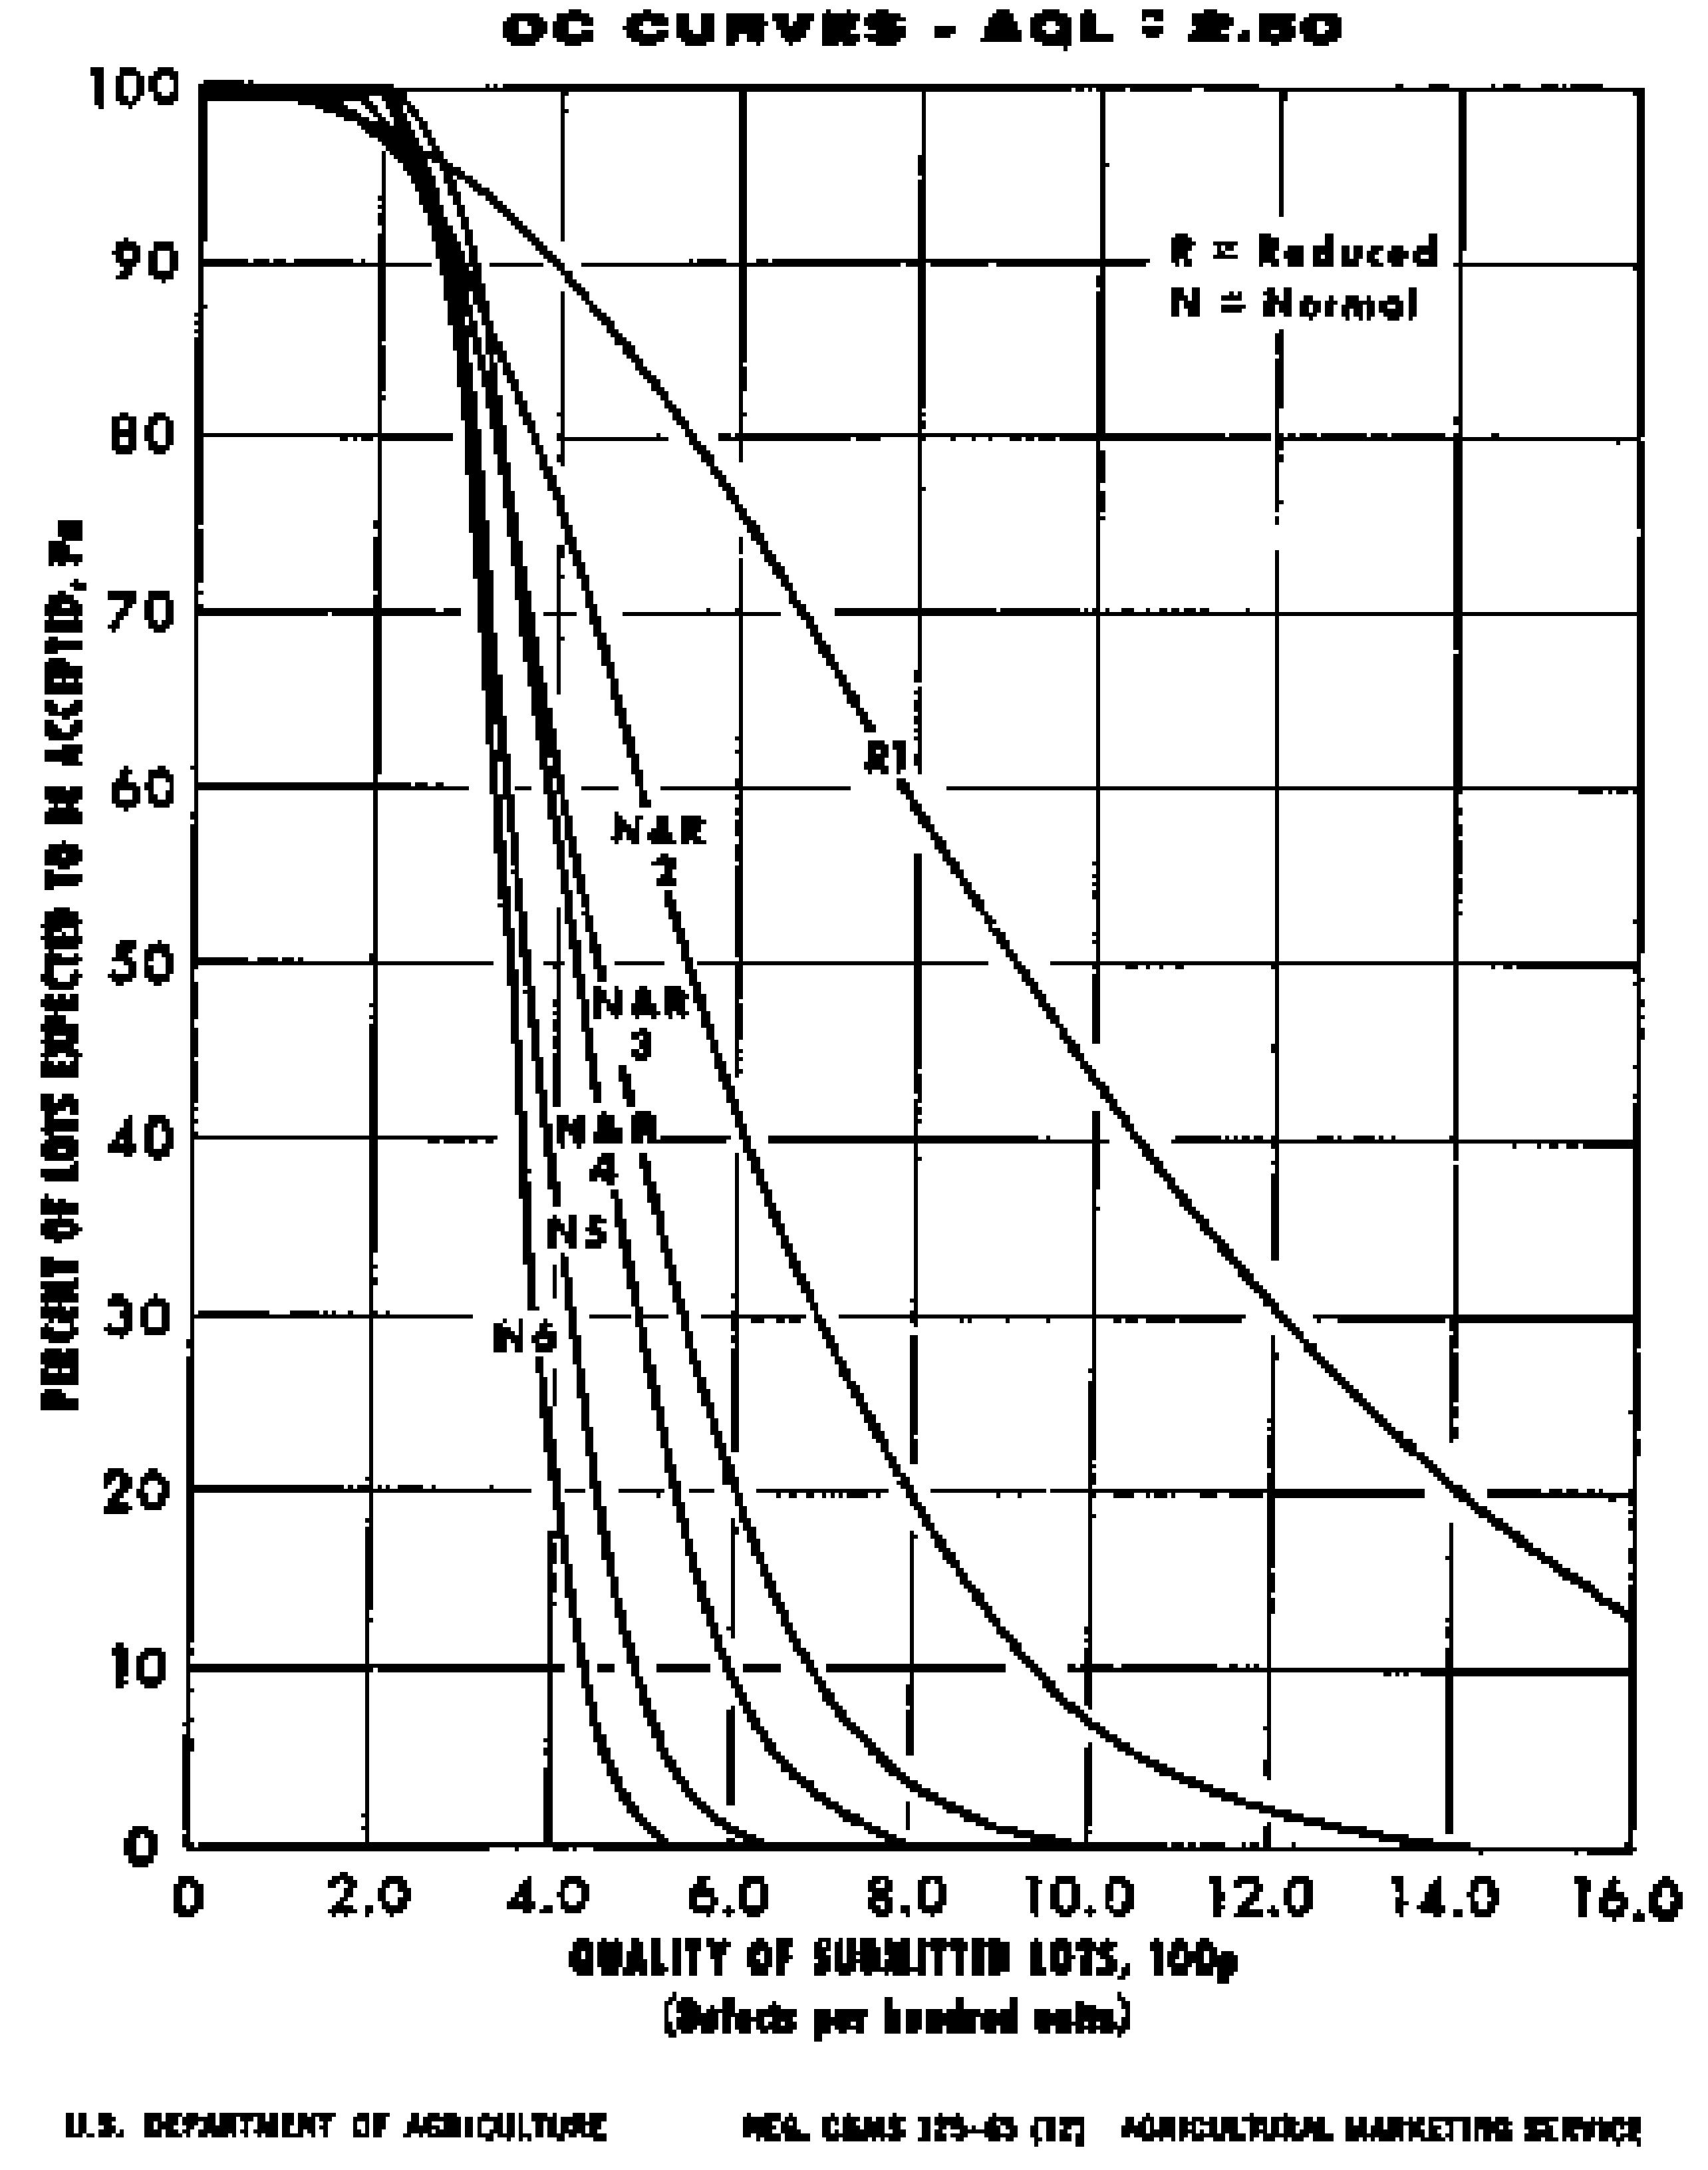
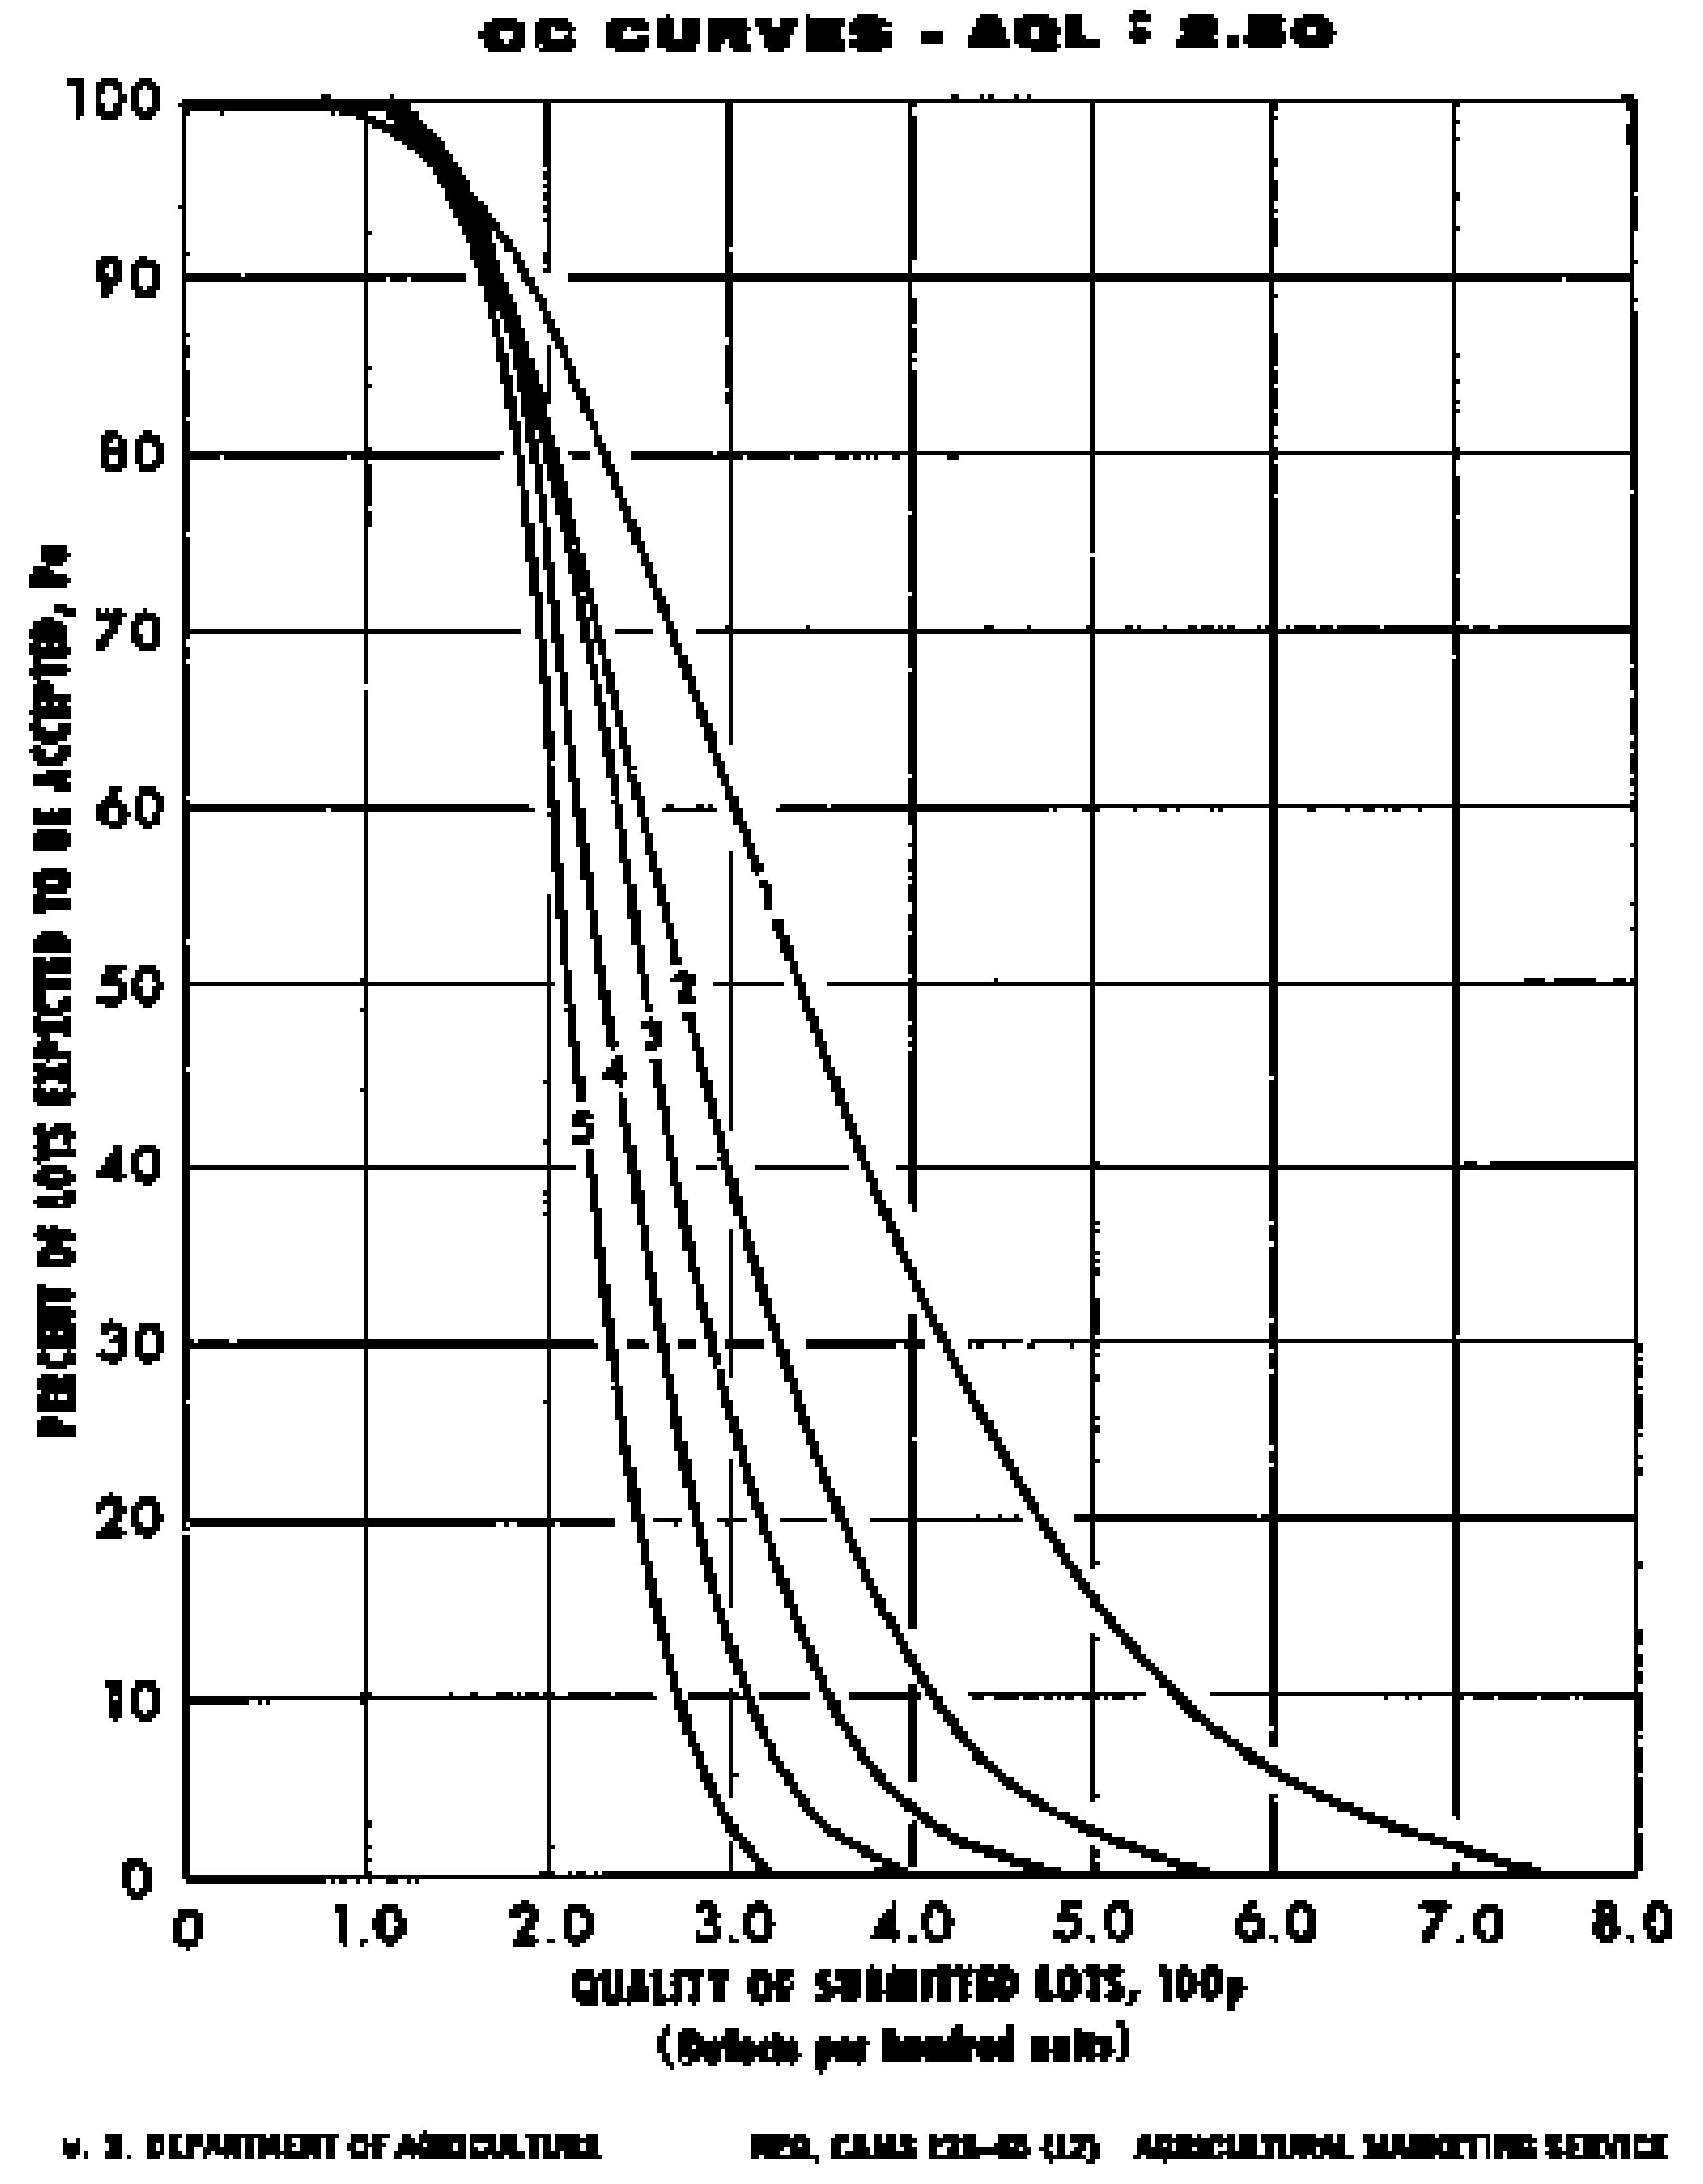
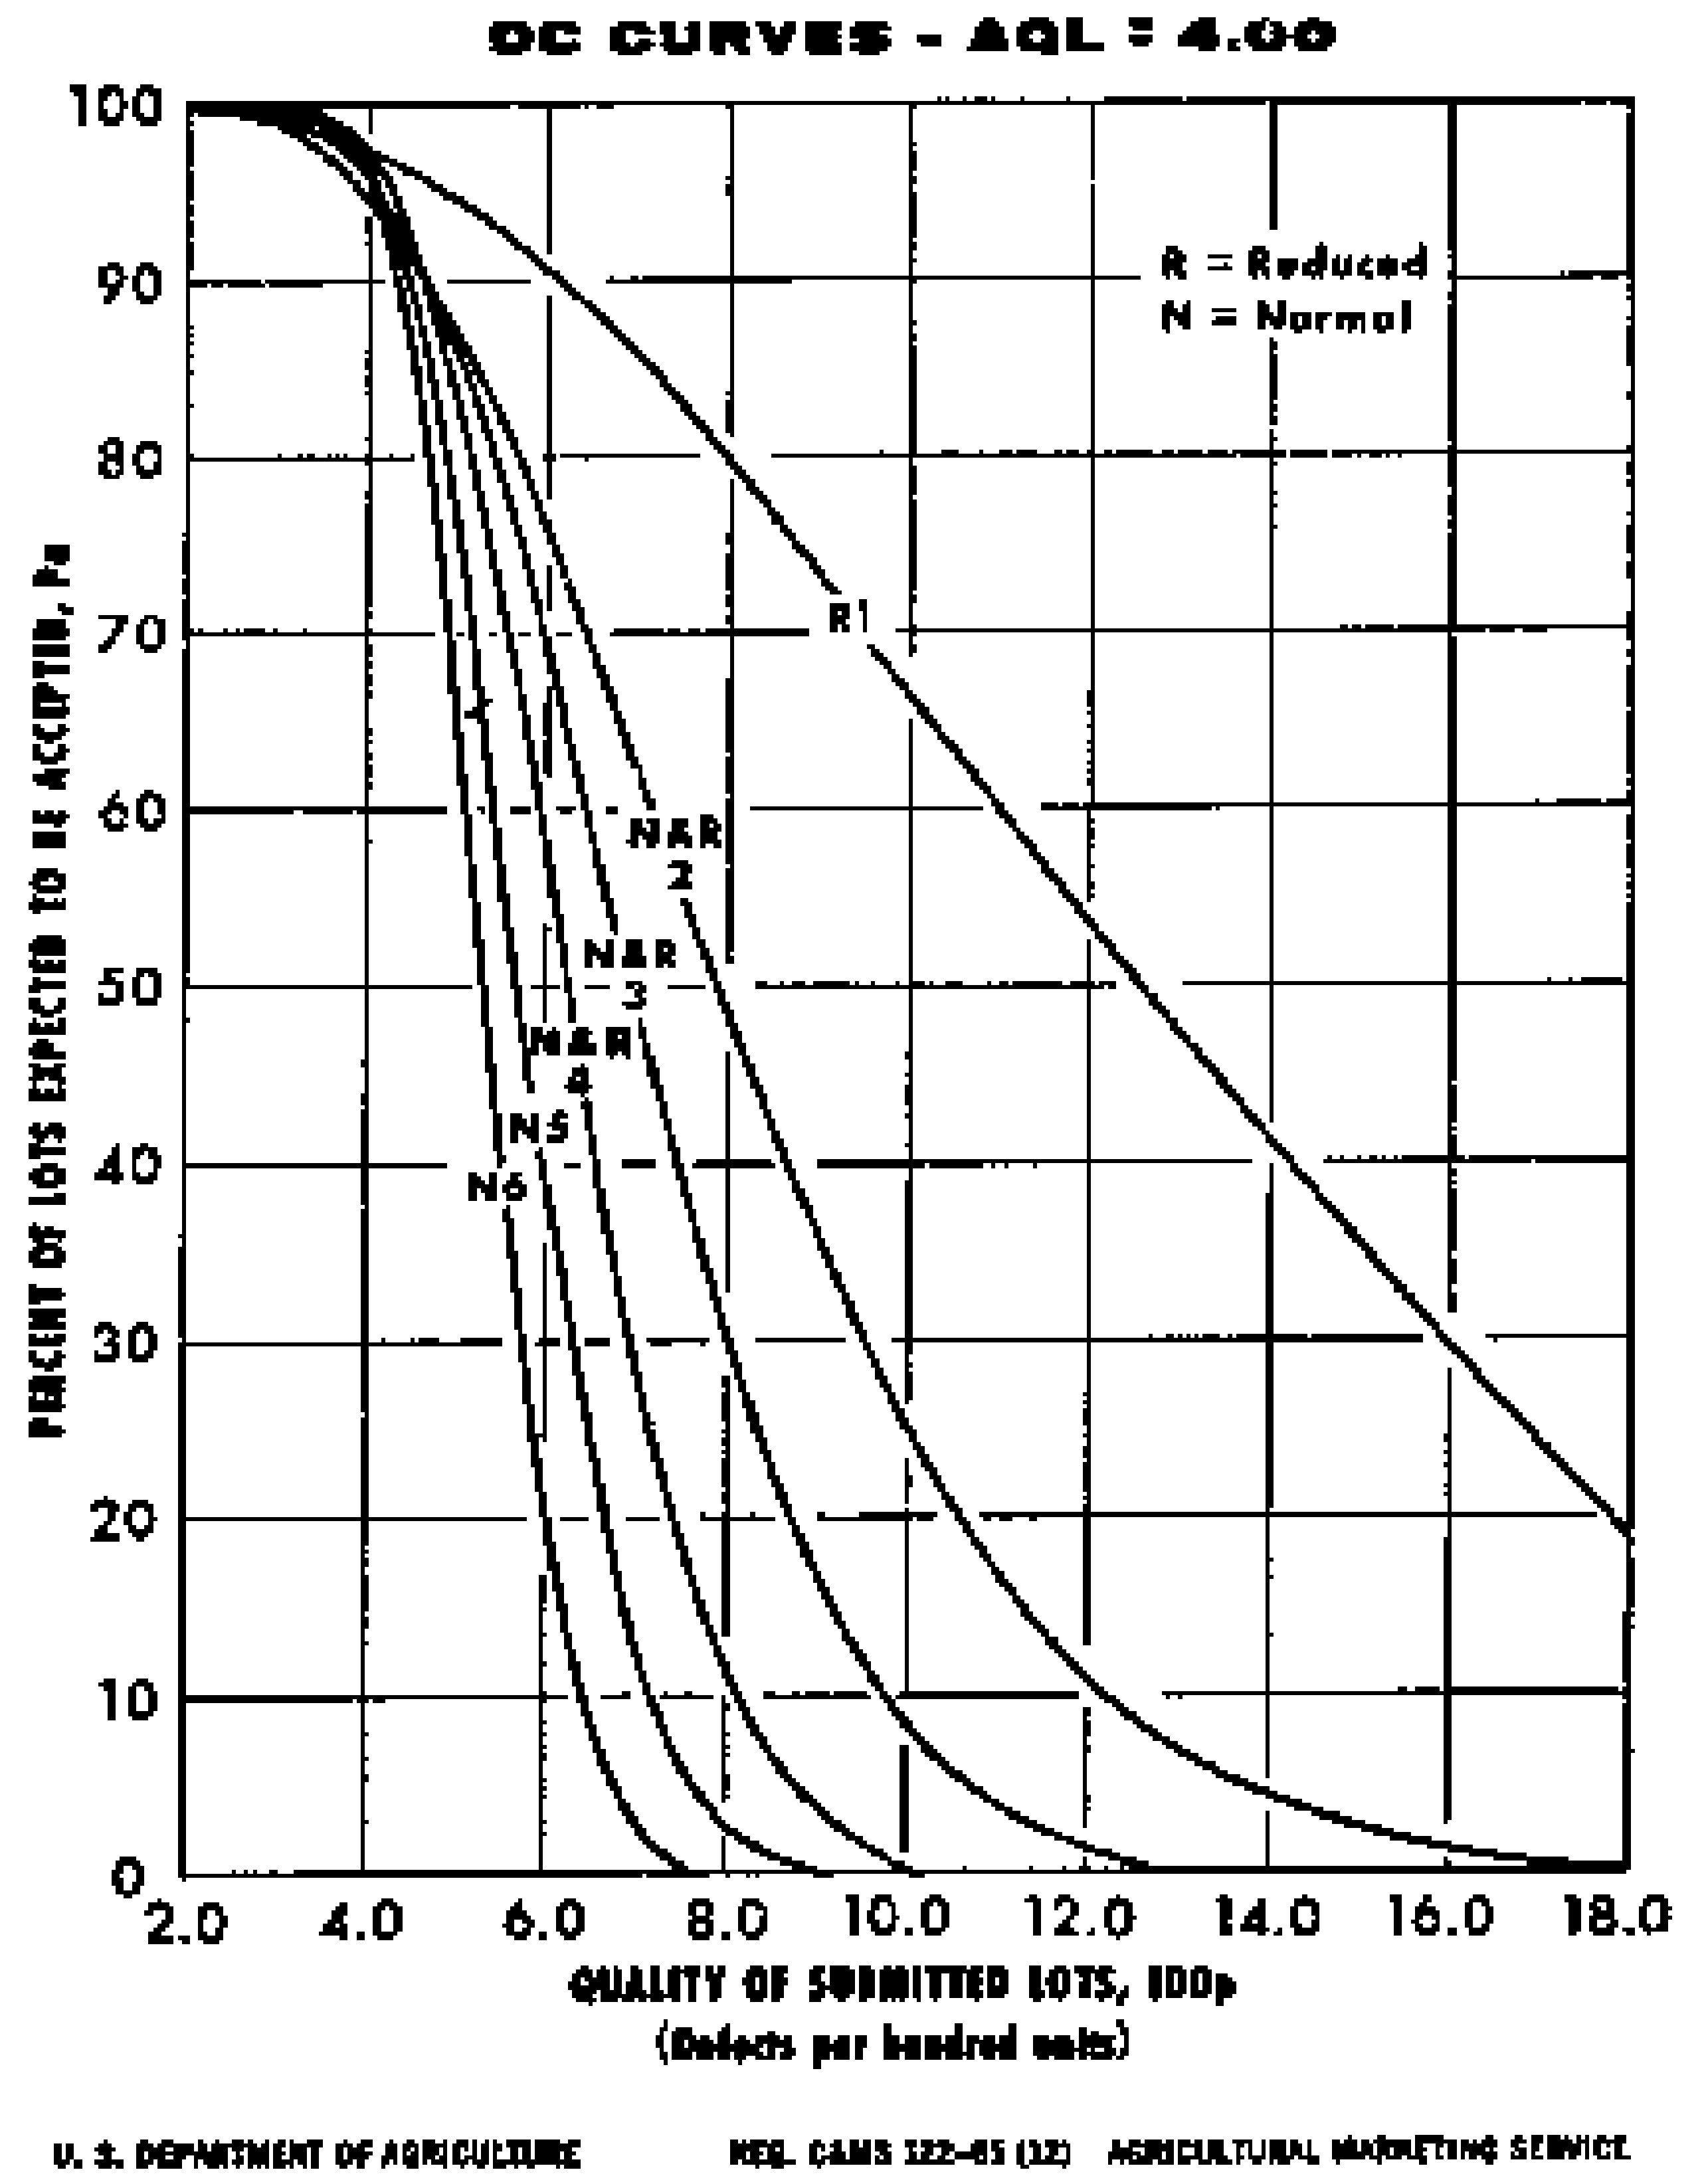
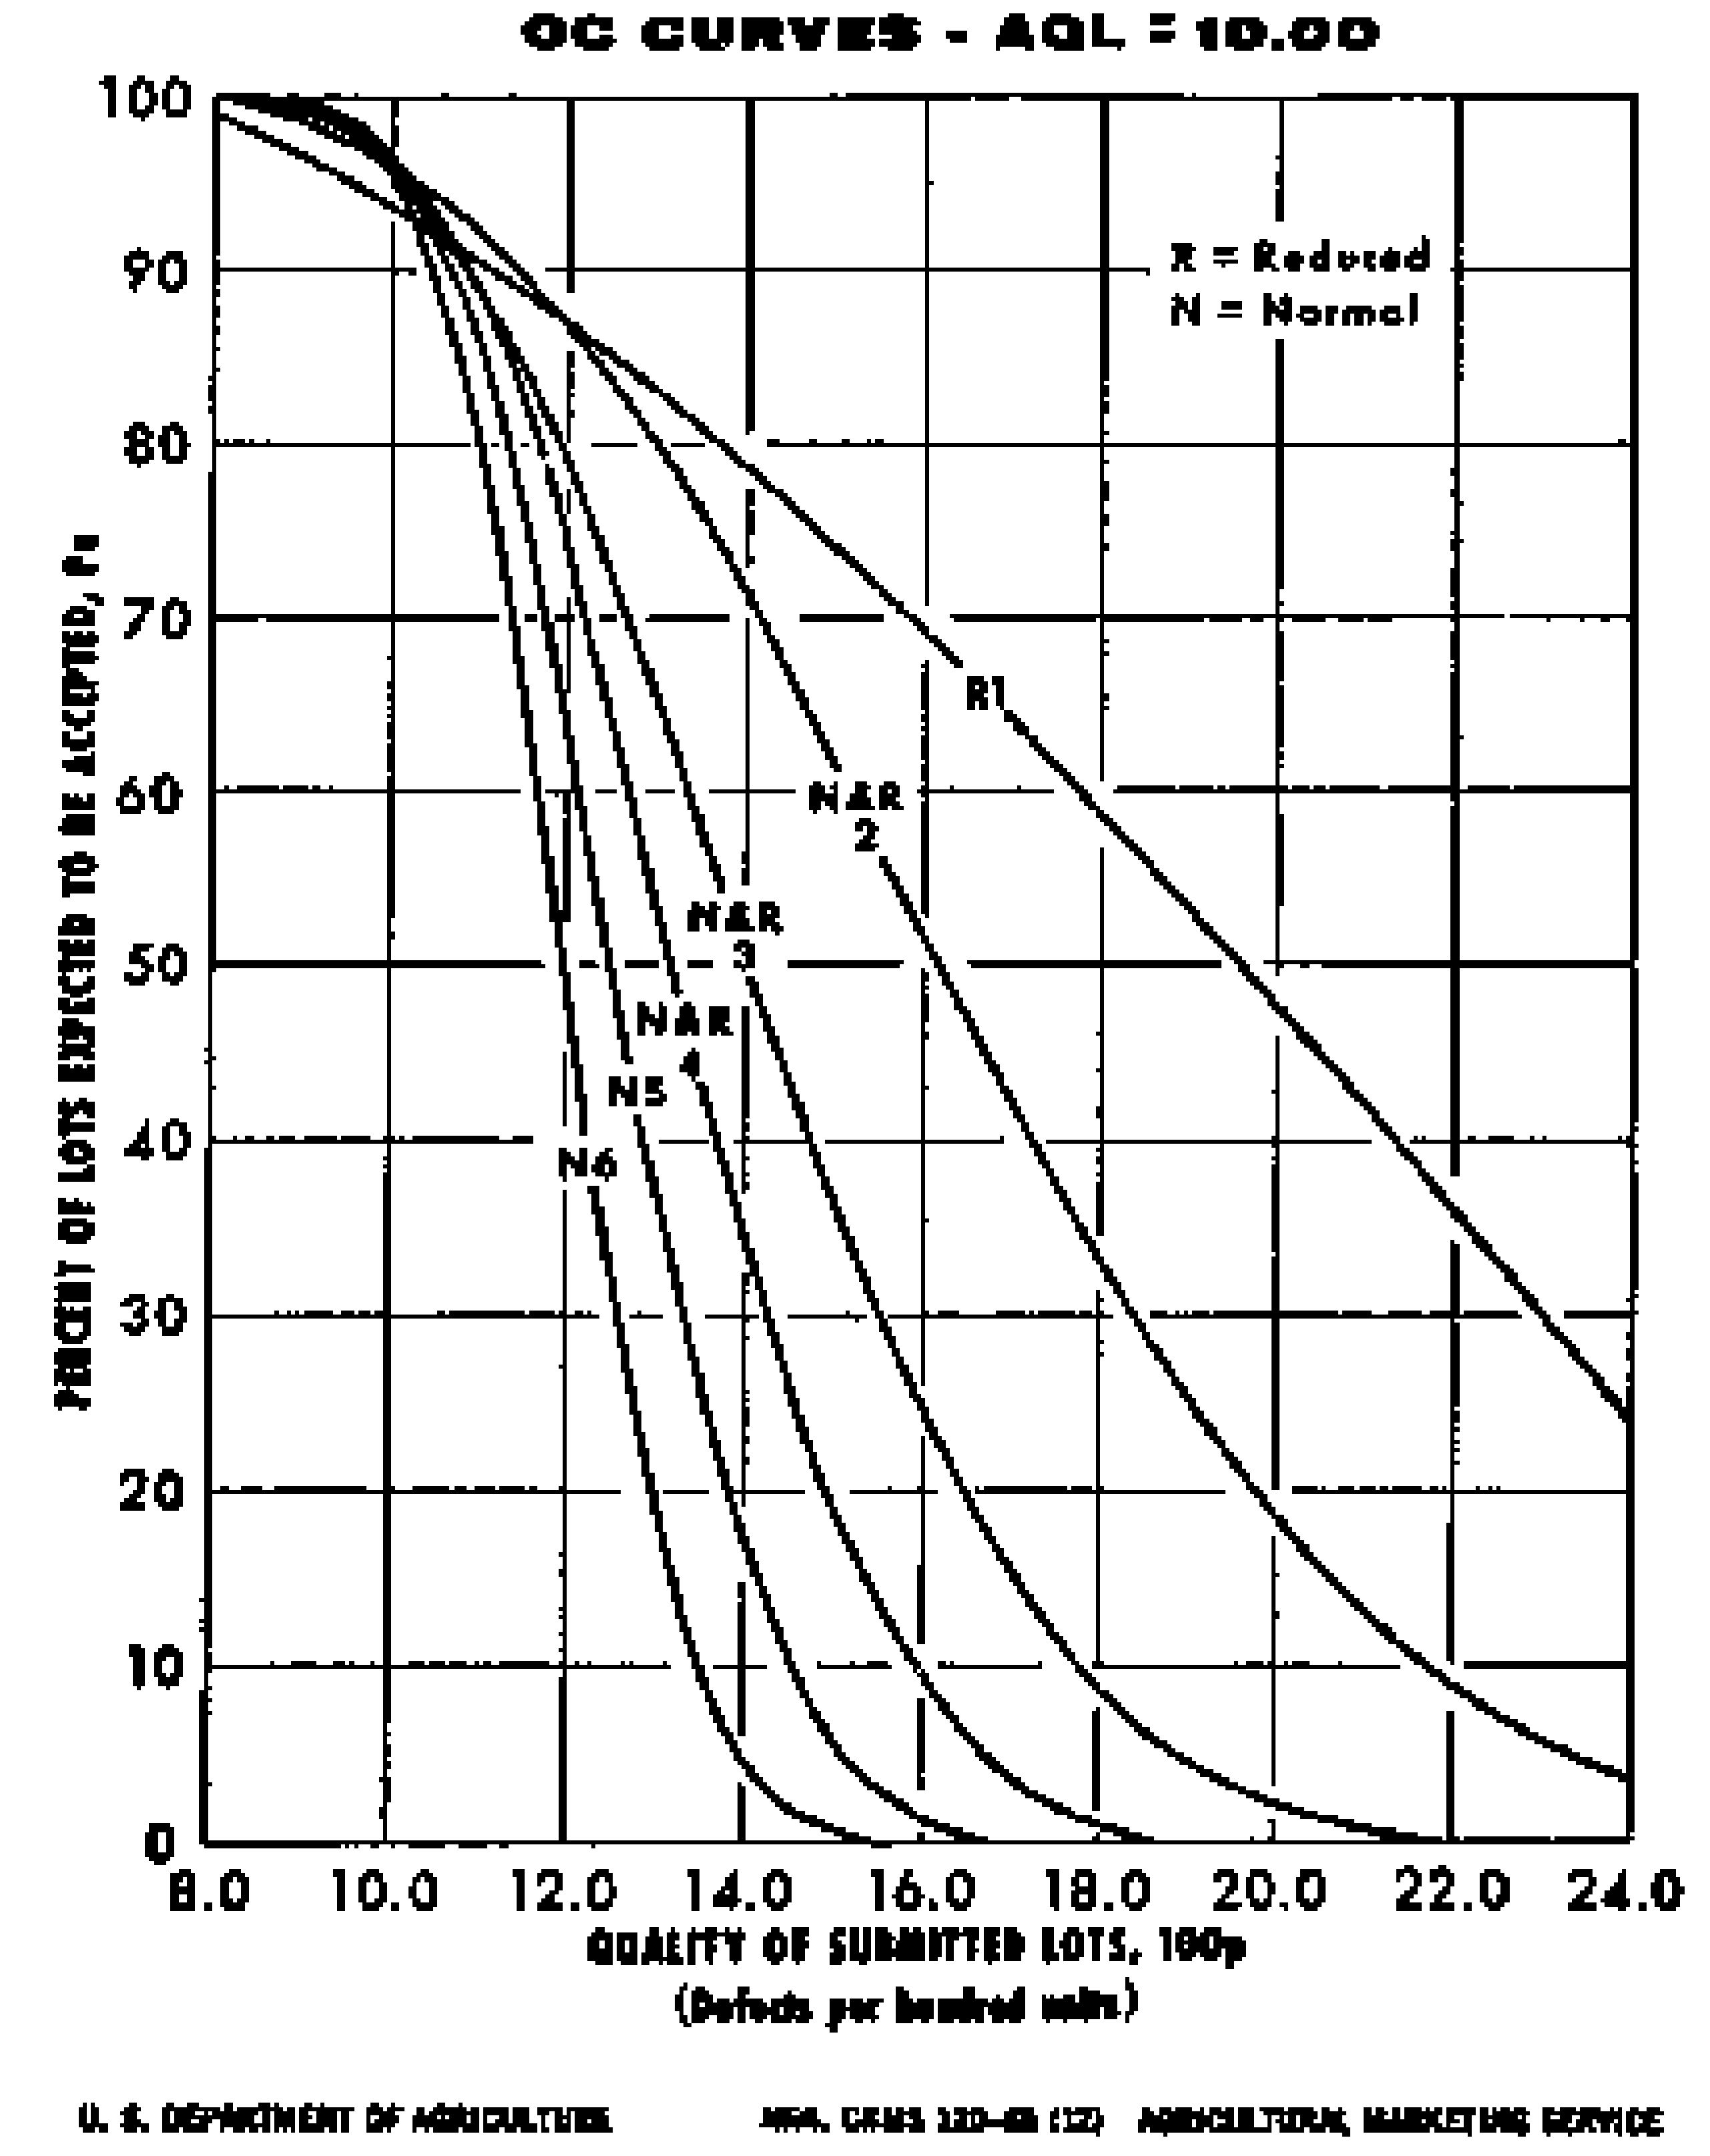
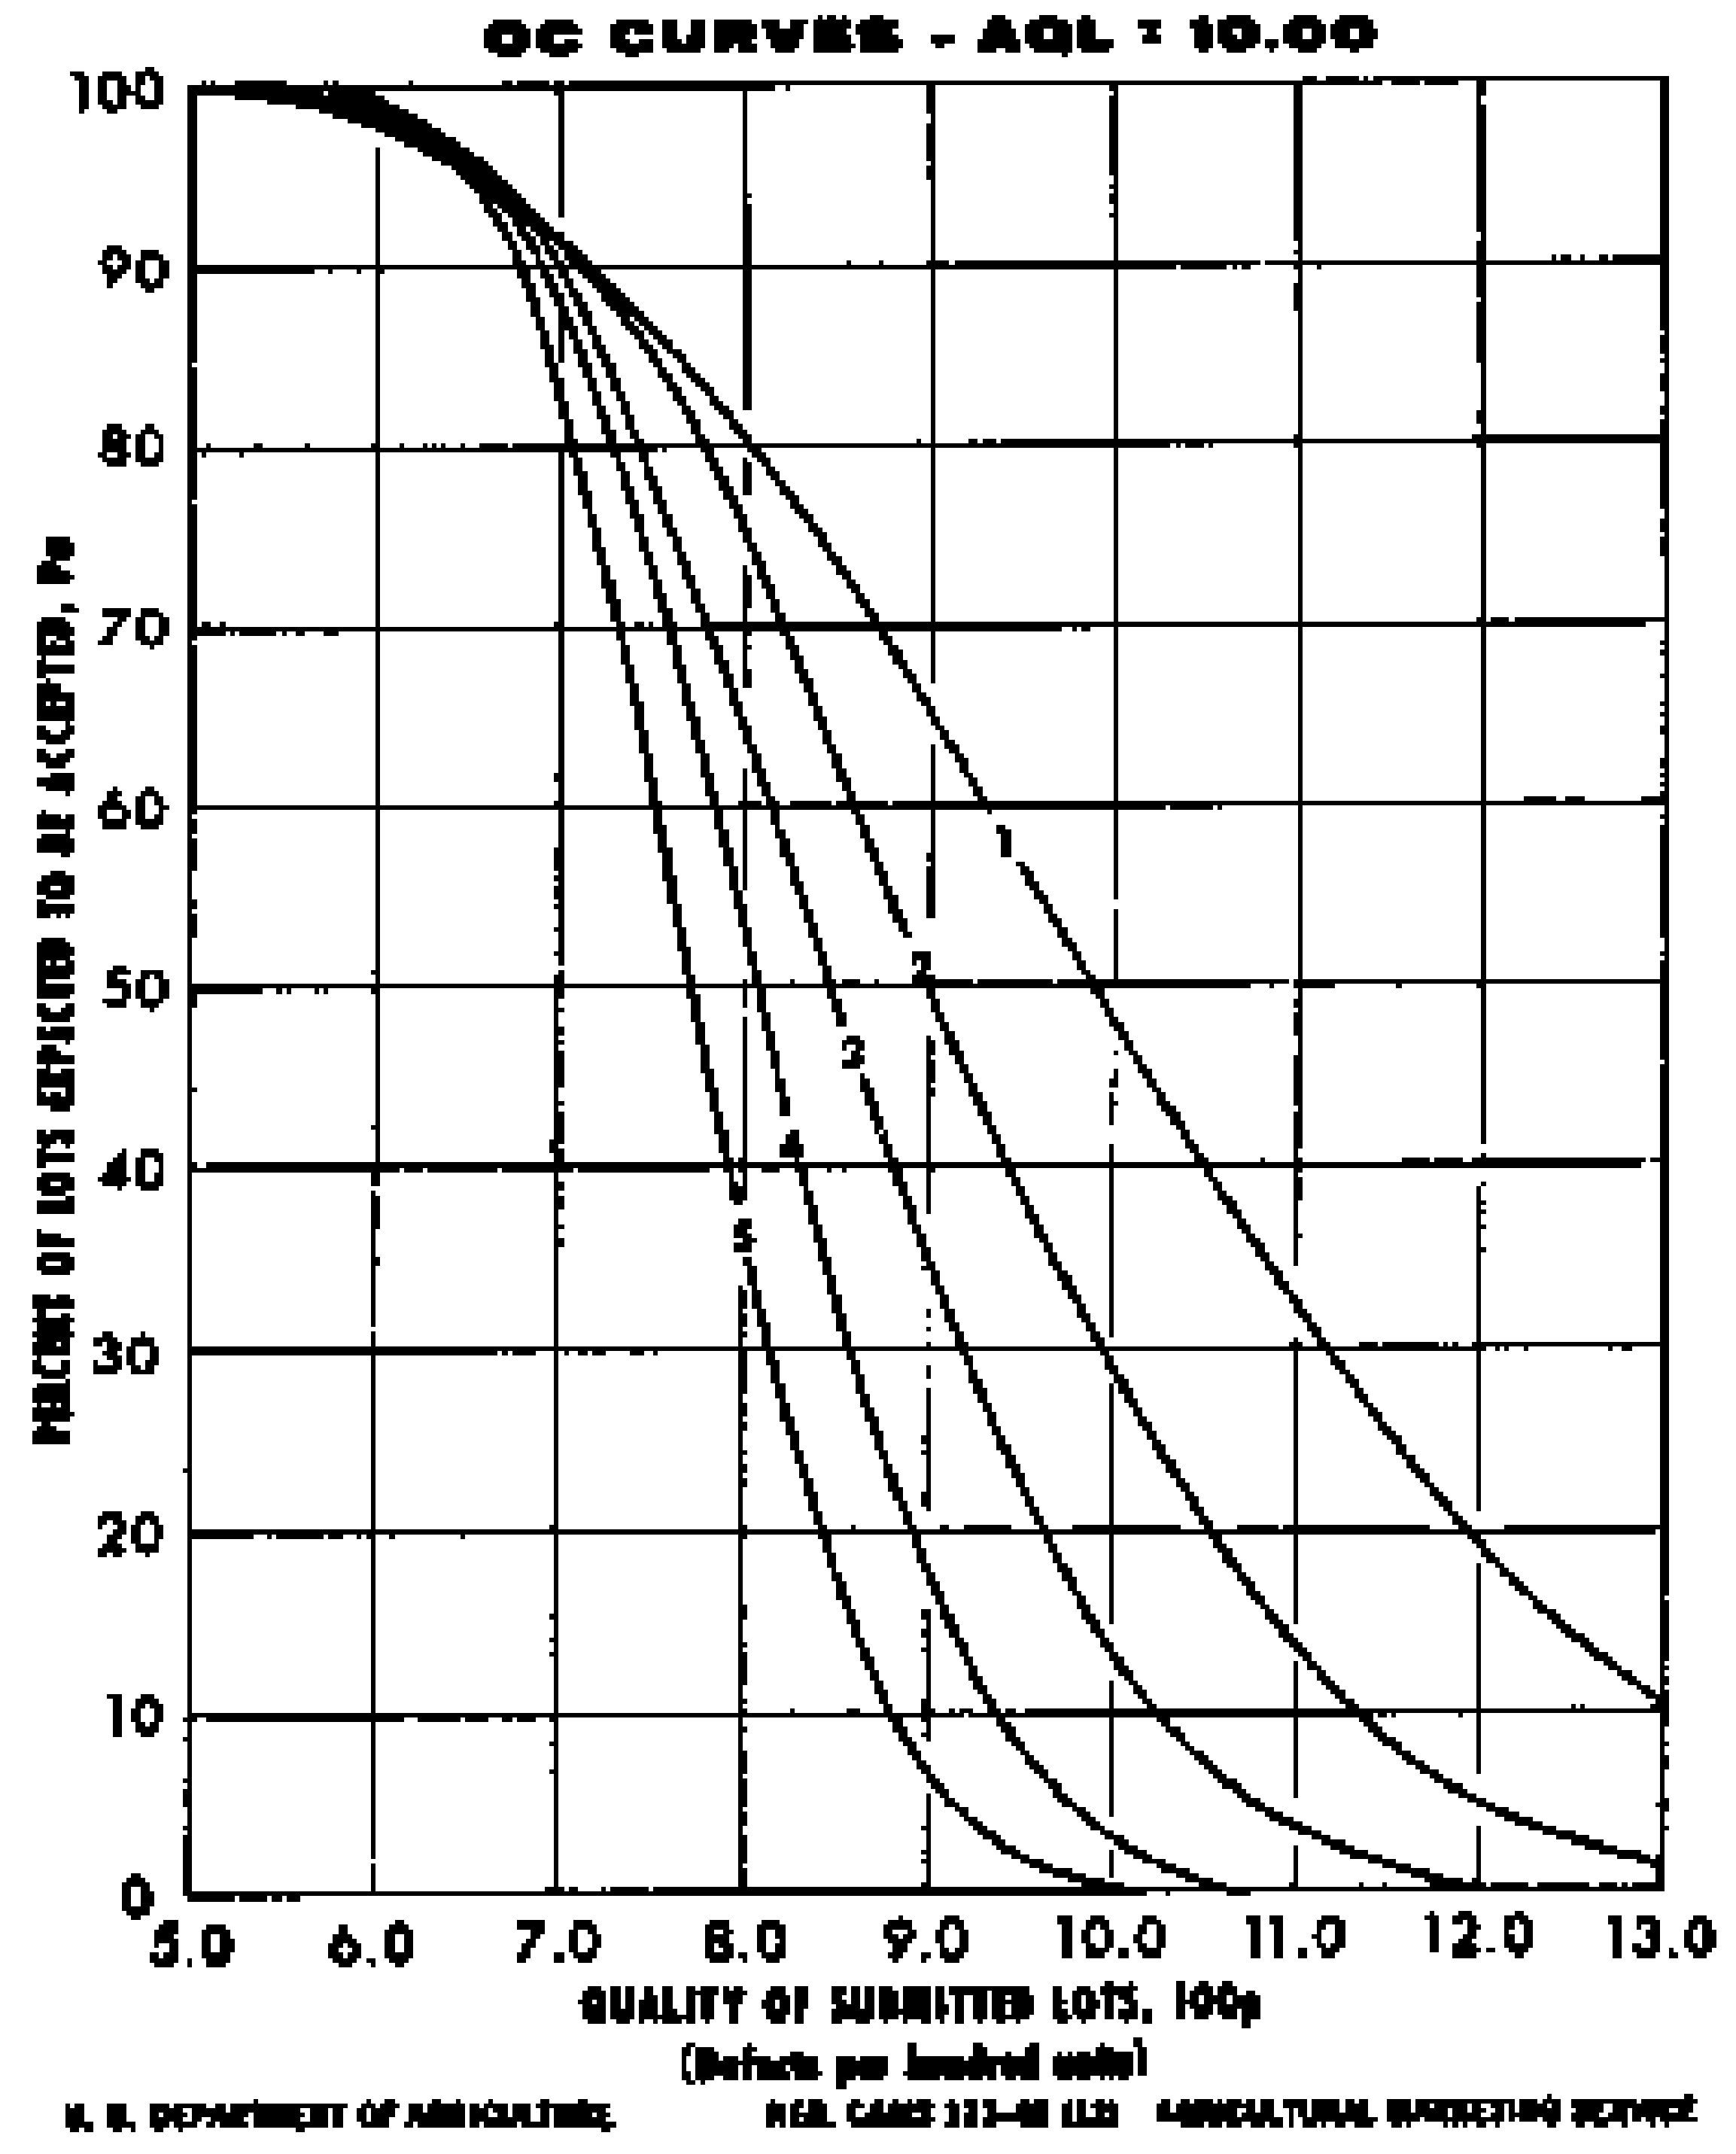
(a) This section contains the Operating Characteristic (OC) curve for each of the sampling plans given in Tables I, I–A, II, II–A, III, and III–A. The OC curve and the corresponding sampling plans are listed by AQL.
(b) Different acceptance and rejection criteria are provided for each AQL. The criteria for each AQL must be obtained from the applicable sampling plan tables.
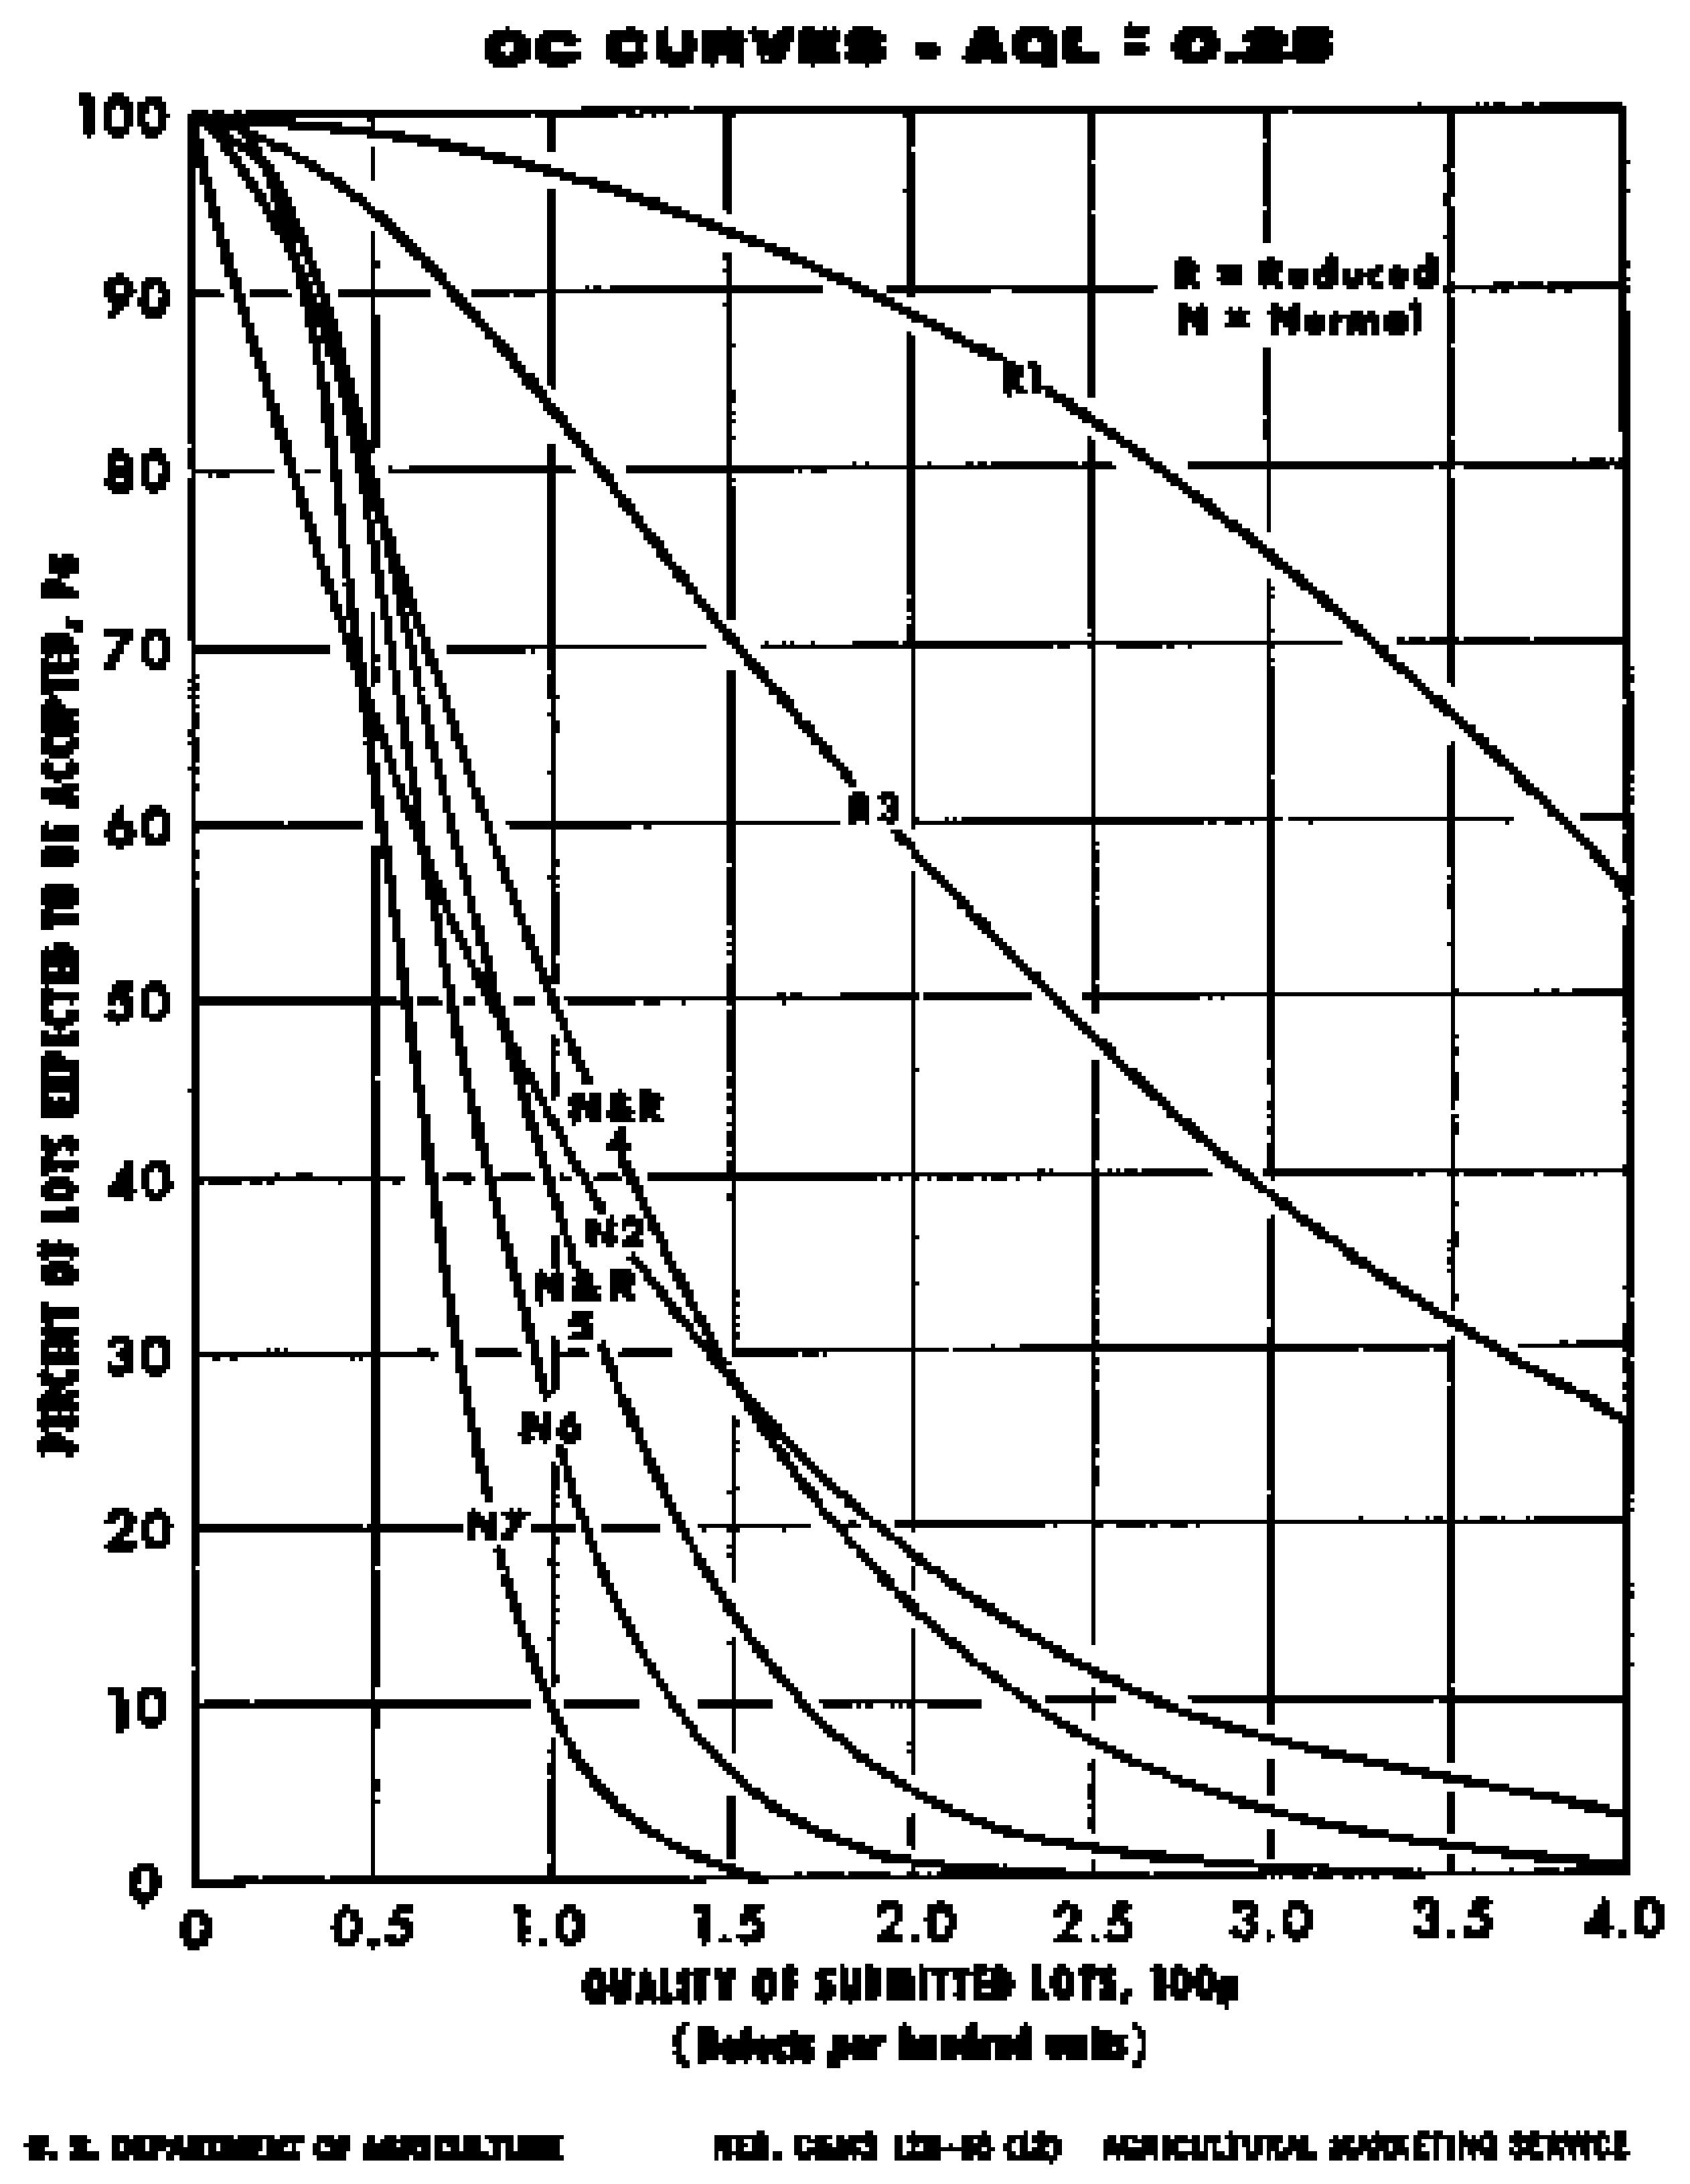
(c) The curves show the ability of the various sampling plans to distinguish between good and bad lots. This can be illustrated by examining OC curve 6 for an AQL of 0.25 defects per hundred units in the Reduced and Normal Inspection Plans. If the quality of the lots submitted for inspection is poorer than the AQL of 0.25 defects per hundred units, fewer lots will be accepted. For example, OC curve 6 shows that when the quality of lots submitted for inspection is 1.0 defects per hundred units, only 26 percent of the lots are expected to be accepted. Conversely when the quality of the lots submitted for inspection is better than the AQL of 0.25 defects per hundred units, most lots are expected to be accepted. For example, the same OC curve 6 shows that when the quality of lots submitted for inspection is 0.10 defects per hundred units, about 99 percent of the lots are expected to be accepted.
(d) The table of sampling plans that correspond to OC curve 6 can be found over the curves for an AQL of 0.25 defects per hundred units in the Reduced and Normal Inspection Plan. An examination of this table reveals that there is one single and one double sampling plan that have OC curves comparable to OC curve 6. The first plan listed is a single plan requiring the inspection of 500 individual containers. Under this plan the lot is accepted as meeting the requirements for an AQL of 0.25 if there are 3 or less defects in the sample or rejected if there are 4 or more defects in the sample.
(e) The next plan that is listed in the column headed 6 for an AQL of 0.25 is a double sampling plan that requires the initial inspection of 228 individual containers. The lot will be accepted as meeting the requirements of an AQL of 0.25 if there are no defects in the sample, and rejected if there are 3 or more defects in the sample. In the event that the number of defects is between the acceptance (0) and rejection (3) numbers, additional containers must be inspected. In this case, the table indicates that a total of 516 containers must be inspected before a decision can be made to either accept or reject the lot. This will require the inspection of 288 more containers (516—228=288).
If there are 3 or less defects in the total sample, the lot will be accepted. If there are 4 or more defects in the total sample, the lot will be rejected. The other double sampling plans operate in a similar manner with the only differences being the sample sizes and acceptance and rejection numbers.
|
REDUCED AND NORMAL INSPECTION PLANS—SAMPLING PLANS AND OPERATING CHARACTERISTIC (OC) CURVES FOR AQL = 0.15 DEFECTS PER HUNDRED UNITS |
||||||||||||
|
[Sampling plans—AQL = 0.15] |
||||||||||||
|
Identification number of OC curve |
||||||||||||
|
Comparable sampling |
R1 |
R2 |
R3 |
R4 |
||||||||
|
plans |
nc |
Ac |
Re |
nc |
Ac |
Re |
nc |
Ac |
Re |
nc |
Ac |
Re |
|
Single․․․․․․․․․․․․․․․․․․․․․ |
29 |
1 |
2 |
84 |
1 |
2 |
126 |
0 |
1 |
315 |
1 |
2 |
|
Double․․․․․․․․․․․․․․․․․․․․․ |
18 |
0 |
2 |
36 |
0 |
2 |
․․․․․ |
․․․․․ |
․․․․․ |
․․․․․ |
․․․․․ |
․․․․․ |
|
36 |
1 |
2 |
96 |
1 |
2 |
․․․․․ |
․․․․․ |
․․․․․ |
․․․․․ |
․․․․․ |
․․․․․ |
|
REDUCED AND NORMAL INSPECTION PLANS—SAMPLING PLANS AND OPERATING CHARACTERISTIC (OC) CURVES FOR AQL = 0.15 DEFECTS PER HUNDRED UNITS |
|||||||||
|---|---|---|---|---|---|---|---|---|---|
|
[Sampling plans—AQL = 0.15] |
|||||||||
|
Identification number of OC curve |
|||||||||
|
N4 |
N5 |
N6 |
|||||||
|
Comparative sampling plans |
nc |
Ac |
Re |
nc |
Ac |
Re |
nc |
Ac |
Re |
|
Single |
168 |
1 |
2 |
264 |
1 |
2 |
500 |
2 |
3 |
|
Double |
120 |
0 |
2 |
174 |
0 |
2 |
252 |
0 |
3 |
|
180 |
1 |
2 |
336 |
1 |
2 |
540 |
2 |
3 |
|
Identification number of OC curve |
||||||
|
N7 |
N8 |
|||||
|
Comparable sampling plans |
nc |
Ac |
Re |
nc |
Ac |
Re |
|
Single․․․․․․․․․․․․․․․․․․․․․․․․․․․ |
800 |
3 |
4 |
1,250 |
4 |
5 |
|
Double․․․․․․․․․․․․․․․․․․․․․․․․․․․ |
456 |
0 |
4 |
․․․․․․․․․․․ |
․․․․․․․․․․․ |
․․․․․․․․․․․ |
|
864 |
3 |
4 |
․․․․․․․․․․․ |
․․․․․․․․․․․ |
․․․․․․․․․․․ |
|
|
nc = Cumulative sample size. Ac = Acceptance number. Re = Rejection number. |
|
TIGHTENED INSPECTION PLANS—SAMPLING PLANS AND OPERATING CHARACTERISTIC (OC) CURVES FOR AQL = 0.15 DEFECTS PER HUNDRED UNITS |
||||||||||||
|
[Sampling plans—AQL = 0.15] |
||||||||||||
|
Identification number of OC curves |
||||||||||||
|
1 |
2 |
3 |
4 |
|||||||||
|
Comparable sampling plans |
nc |
Ac |
Re |
nc |
Ac |
Re |
nc |
Ac |
Re |
nc |
Ac |
Re |
|
Single |
264 |
0 |
1 |
500 |
1 |
2 |
800 |
2 |
3 |
1,250 |
3 |
4 |
|
Double |
360 |
0 |
2 |
456 |
0 |
3 |
576 |
0 |
3 |
|||
|
516 |
1 |
2 |
864 |
2 |
3 |
1,296 |
3 |
4 |
||||
|
nc = Cumulative sample size. Ac = Acceptance number. Re = Rejection number. |
|
REDUCED AND NORMAL INSPECTION PLANS—SAMPLING PLANS AND OPERATING CHARACTERISTIC (OC) CURVES FOR AQL = 0.25 DEFECTS PER HUNDRED UNITS |
||||||||||||
|
[Sampling plans—AQL = 0.25] |
||||||||||||
|
Identification number OC curves |
||||||||||||
|
R1 |
N2 |
R3 |
N and R4 |
|||||||||
|
Comparable sampling plans |
nc |
Ac |
Re |
nc |
Ac |
Re |
nc |
Ac |
Re |
nc |
Ac |
Re |
|
Single |
29 |
1 |
2 |
84 |
0 |
1 |
84 |
1 |
2 |
168 |
1 |
2 |
|
Double |
18 |
0 |
2 |
36 |
0 |
2 |
120 |
0 |
2 |
168 |
0 |
|
|
18 |
1 |
2 |
96 |
1 |
2 |
180 |
1 |
2 |
348 |
2 |
|
Identification number OC curves |
|||||||||
|
N and R5 |
N6 |
N7 |
|||||||
|
Comparable sampling plans |
nc |
Ac |
Re |
nc |
Ac |
Re |
nc |
Ac |
Re |
|
Single |
315 |
2 |
3 |
500 |
3 |
4 |
800 |
4 |
5 |
|
Double |
3 |
228 |
0 |
3 |
|||||
|
3 |
516 |
3 |
4 |
||||||
|
nc = Cumulative sample size. Ac = Acceptance number. Re = Rejection number. |
|
TIGHTENED INSPECTION PLANS—SAMPLING PLANS AND OPERATION CHARACTERISTICS (OC) CURVES FOR AQL = 0.25 DEFECTS PER HUNDRED UNITS |
|||||||||||||||
|
[Sampling plans—AQL = 0.25] |
|||||||||||||||
|
Identification number of OC curves |
|||||||||||||||
|
Comparable sampling |
1 |
2 |
3 |
4 |
5 |
||||||||||
|
plans․․․․․․․․․․․․․․․․․․․ |
nc |
Ac |
Re |
nc |
Ac |
Re |
nc |
Ac |
Re |
nc |
Ac |
Re |
nc |
Ac |
Re |
|
Single․․․․․․․․․․․․․․․․․․ |
168 |
0 |
1 |
315 |
1 |
2 |
500 |
2 |
3 |
800 |
3 |
4 |
1,250 |
4 |
5 |
|
Double․․․․․․․․․․․․․․․․․․ |
․․․․․ |
․․․․․ |
․․․․․ |
168 |
0 |
2 |
228 |
0 |
3 |
456 |
0 |
4 |
․․․․․ |
․․․․․ |
․․․․․ |
|
․․․․․ |
․․․․․ |
․․․․․ |
348 |
1 |
2 |
516 |
2 |
3 |
864 |
3 |
4 |
․․․․․ |
․․․․․ |
․․․․․ |
|
|
nc = Cumulative sample size. Ac = Acceptance number. Re = Rejection number. |
|
REDUCED AND NORMAL INSPECTION PLANS—SAMPLING PLANS AND OPERATING CHARACTERISTIC (OC) CURVES FOR AQL = 0.50 DEFECTS PER HUNDRED UNITS |
|||||||||
|
[Sampling plans—AQL = 0.50] |
|||||||||
|
Identification number of OC curves |
|||||||||
|
R1 |
N and R2 |
N and R3 |
|||||||
|
Comparable sampling plans |
nc |
Ac |
Re |
nc |
Ac |
Re |
nc |
Ac |
Re |
|
Single |
29 |
1 |
2 |
84 |
1 |
2 |
168 |
2 |
3 |
|
Double |
18 |
0 |
2 |
36 |
0 |
2 |
120 |
0 |
3 |
|
36 |
1 |
2 |
96 |
1 |
2 |
180 |
2 |
3 |
|
Identification number of OC curves |
|||||||||
|
N and R4 |
N5 |
N6 |
|||||||
|
Comparable sampling plans |
nc |
Ac |
Re |
nc |
Ac |
Re |
nc |
Ac |
Re |
|
Single |
315 |
3 |
4 |
500 |
5 |
6 |
800 |
7 |
8 |
|
Double |
168 |
0 |
4 |
228 |
0 |
5 |
|||
|
348 |
3 |
4 |
516 |
5 |
6 |
||||
|
nc = Cumulative sample size. Ac = Acceptance number. Re = Rejection number. |
|
TIGHTENED INSPECTION PLANS—SAMPLING PLANS AND OPERATING CHARACTERISTIC (OC) CURVES FOR AQL = 0.50 DEFECTS PER HUNDRED UNITS |
|||||||||
|
[Sampling plans—AQL = 0.50] |
|||||||||
|
Identification number of OC curves |
|||||||||
|
1 |
2 |
3 |
|||||||
|
Comparable sampling plans |
nc |
Ac |
Re |
nc |
Ac |
Re |
nc |
Ac |
Re |
|
Single |
168 |
1 |
2 |
315 |
2 |
3 |
500 |
3 |
4 |
|
Double |
120 |
0 |
2 |
168 |
0 |
3 |
228 |
0 |
3 |
|
180 |
1 |
2 |
348 |
2 |
3 |
516 |
3 |
4 |
|
Identification number of OC curves |
||||||
|
4 |
5 |
|||||
|
Comparable sampling plans |
nc |
Ac |
Re |
nc |
Ac |
Re |
|
Single․․․․․․․․․․․․․․․․․․․․․․․․․․․ |
800 |
4 |
5 |
1,250 |
6 |
7 |
|
Double․․․․․․․․․․․․․․․․․․․․․․․․․․․ |
456 |
1 |
5 |
․․․․․․․․․․․ |
․․․․․․․․․․․ |
․․․․․․․․․․․ |
|
864 |
4 |
5 |
․․․․․․․․․․․ |
․․․․․․․․․․․ |
․․․․․․․․․․․ |
|
|
nc = Cumulative sample size. Ac = Acceptance number. Re = Rejection number. |
|
REDUCED AND NORMAL INSPECTION PLANS—SAMPLING PLANS AND OPERATING CHARACTERISTIC (OC) CURVES FOR AQL = 1.00 DEFECTS PER HUNDRED UNITS |
|||||||||
|
[Sampling plans—AQL = 1.00] |
|||||||||
|
Identification number of OC curves |
|||||||||
|
Comparable sampling |
R1 |
N and R2 |
N and R3 |
||||||
|
plans |
nc |
Ac |
Re |
nc |
Ac |
Re |
nc |
Ac |
Re |
|
Single |
29 |
1 |
2 |
84 |
2 |
3 |
168 |
4 |
5 |
|
Double |
18 |
0 |
2 |
36 |
0 |
3 |
120 |
2 |
5 |
|
36 |
1 |
2 |
96 |
2 |
3 |
180 |
4 |
5 |
|
Identification number of OC curves |
|||||||||
|
Comparable sampling |
N and R4 |
N5 |
N6 |
||||||
|
plans |
nc |
Ac |
Re |
nc |
Ac |
Re |
nc |
Ac |
Re |
|
Single |
315 |
6 |
7 |
500 |
9 |
10 |
800 |
13 |
14 |
|
Double |
168 |
1 |
5 |
228 |
2 |
7 |
|||
|
348 |
7 |
8 |
516 |
9 |
10 |
||||
|
nc = Cumulative sample size. Ac = Acceptance number. Re = Rejection number. |
|
TIGHTENED INSPECTION PLANS—SAMPLING PLANS AND OPERATING CHARACTERISTIC (OC) CURVES FOR AQL = 1.00 DEFECTS PER HUNDRED UNITS |
|||||||||
|
[Sampling plans—AQL = 1.00] |
|||||||||
|
Identification number of OC curves |
|||||||||
|
Comparable sampling |
1 |
2 |
3 |
||||||
|
plans |
nc |
Ac |
Re |
nc |
Ac |
Re |
nc |
Ac |
Re |
|
Single |
168 |
2 |
3 |
315 |
3 |
4 |
500 |
5 |
6 |
|
Double |
120 |
0 |
3 |
168 |
0 |
4 |
228 |
0 |
5 |
|
180 |
2 |
3 |
348 |
3 |
4 |
516 |
5 |
6 |
|
Identification number of OC curves |
||||||
|
Comparable sampling |
4 |
5 |
||||
|
plans |
nc |
Ac |
Re |
nc |
Ac |
Re |
|
Single |
800 |
7 |
8 |
1,250 |
10 |
11 |
|
Double |
456 |
2 |
6 |
|||
|
864 |
8 |
9 |
||||
|
nc = Cumulative sample size. Ac = Acceptance number. Re = Rejection number. |
|
REDUCED AND NORMAL INSPECTION PLANS—SAMPLING PLANS AND OPERATING CHARACTERISTIC (OC) CURVES FOR AQL = 1.50 DEFECTS PER HUNDRED UNITS |
|||||||||
|
[Sampling plans—AQL = 1.50] |
|||||||||
|
Identification number of OC curves |
|||||||||
|
Comparable sampling |
R1 |
N and R2 |
N and R3 |
||||||
|
plans |
nc |
Ac |
Re |
nc |
Ac |
Re |
nc |
Ac |
Re |
|
Single |
29 |
1 |
2 |
84 |
3 |
4 |
168 |
5 |
6 |
|
Double |
18 |
0 |
2 |
36 |
0 |
4 |
120 |
2 |
6 |
|
36 |
1 |
2 |
96 |
3 |
4 |
180 |
5 |
6 |
|
Identification number of OC curves |
|||||||||
|
Comparable sampling |
N and R4 |
N5 |
N6 |
||||||
|
plans |
nc |
Ac |
Re |
nc |
Ac |
Re |
nc |
Ac |
Re |
|
Single |
315 |
8 |
9 |
500 |
12 |
13 |
800 |
18 |
19 |
|
Double |
168 |
2 |
7 |
228 |
3 |
9 |
|||
|
348 |
9 |
10 |
516 |
12 |
13 |
||||
|
nc = Cumulative sample size. Ac = Acceptance number. Re = Rejection number. |
|
TIGHTENED INSPECTION PLANS—SAMPLING PLANS AND OPERATING CHARACTERISTIC (OC) CURVES FOR AQL = 1.50 DEFECTS PER HUNDRED UNITS |
|||||||||
|
[Sampling plans—AQL = 1.50] |
|||||||||
|
Identification number of OC curves |
|||||||||
|
Comparable sampling |
1 |
2 |
3 |
||||||
|
plans |
nc |
Ac |
Re |
nc |
Ac |
Re |
nc |
Ac |
Re |
|
Single |
168 |
4 |
5 |
315 |
6 |
7 |
500 |
9 |
10 |
|
Double |
120 |
2 |
5 |
168 |
1 |
5 |
228 |
2 |
7 |
|
180 |
4 |
5 |
348 |
7 |
8 |
516 |
9 |
10 |
|
Identification number of OC curves |
||||||
|
Comparable sampling |
4 |
5 |
||||
|
plans |
nc |
Ac |
Re |
nc |
Ac |
Re |
|
Single |
800 |
13 |
14 |
1,250 |
19 |
20 |
|
Double |
456 |
5 |
10 |
|||
|
864 |
14 |
15 |
||||
|
nc = Cumulative sample size. Ac = Acceptance number. Re = Rejection number. |
|
REDUCED AND NORMAL INSPECTION PLANS—SAMPLING PLANS AND OPERATING CHARACTERISTIC (OC) CURVES FOR AQL = 2.50 DEFECTS PER HUNDRED UNITS |
|||||||||
|
[Sampling plans—AQL = 2.50] |
|||||||||
|
Identification number of OC curves |
|||||||||
|
Comparable sampling |
R1 |
N and R2 |
N and R3 |
||||||
|
plans |
nc |
Ac |
Re |
nc |
Ac |
Re |
nc |
Ac |
Re |
|
Single |
29 |
2 |
3 |
84 |
4 |
5 |
168 |
7 |
8 |
|
Double |
18 |
0 |
3 |
36 |
0 |
4 |
120 |
3 |
7 |
|
36 |
2 |
3 |
96 |
4 |
5 |
180 |
8 |
9 |
|
Identification number of OC Curves |
|||||||||
|
Comparable sampling |
N and R4 |
N5 |
N6 |
||||||
|
plans |
nc |
Ac |
Re |
nc |
Ac |
Re |
nc |
Ac |
Re |
|
Single |
315 |
13 |
14 |
500 |
18 |
19 |
800 |
27 |
28 |
|
Double |
168 |
5 |
10 |
228 |
5 |
11 |
|||
|
348 |
14 |
15 |
516 |
19 |
20 |
||||
|
nc = Cumulative sample size. Ac = Acceptance number. Re = Rejection number. |
|
TIGHTENED INSPECTION PLANS—SAMPLING PLANS AND OPERATING CHARACTERISTIC (OC) CURVES FOR AQL = 2.50 DEFECTS PER HUNDRED UNITS |
|||||||||
|
[Sampling plans—AQL = 2.50] |
|||||||||
|
Identification number of OC curves |
|||||||||
|
Comparable sampling |
1 |
2 |
3 |
||||||
|
plans |
nc |
Ac |
Re |
nc |
Ac |
Re |
nc |
Ac |
Re |
|
Single․․․․․․․․․․․․․․․․․․ |
168 |
5 |
6 |
315 |
8 |
9 |
500 |
12 |
13 |
|
Double․․․․․․․․․․․․․․․․․․ |
120 |
2 |
6 |
168 |
2 |
7 |
228 |
3 |
9 |
|
180 |
5 |
6 |
348 |
9 |
10 |
516 |
12 |
13 |
|
Identification number of OC curve |
||||||
|
Comparable sampling |
4 |
5 |
||||
|
plans |
nc |
Ac |
Re |
nc |
Ac |
Re |
|
Single․․․․․․․․․․․․․․․․․․․․․․․․․․․ |
800 |
18 |
19 |
1,250 |
26 |
27 |
|
Double․․․․․․․․․․․․․․․․․․․․․․․․․․․ |
456 |
8 |
13 |
․․․․․․․․․․․ |
․․․․․․․․․․․ |
․․․․․․․․․․․ |
|
864 |
19 |
20 |
․․․․․․․․․․․ |
․․․․․․․․․․․ |
․․․․․․․․․․․ |
|
|
nc = Cumulative sample size. Ac = Acceptance number. Re = Rejection number. |
|
REDUCED AND NORMAL INSPECTION PLANS—SAMPLING PLANS AND OPERATING CHARACTERISTIC (OC) CURVES FOR AQL = 4.00 DEFECTS PER HUNDRED UNITS |
|||||||||
|
[Sampling plans—AQL = 4.00] |
|||||||||
|
Identification number of OC curves |
|||||||||
|
Comparable sampling |
R1 |
N and R2 |
N and R3 |
||||||
|
plans |
nc |
Ac |
Re |
nc |
Ac |
Re |
nc |
Ac |
Re |
|
Single |
29 |
3 |
4 |
84 |
6 |
7 |
168 |
11 |
12 |
|
Double |
18 |
1 |
3 |
36 |
0 |
5 |
120 |
6 |
10 |
|
36 |
4 |
5 |
96 |
7 |
8 |
180 |
12 |
13 |
|
Identification number of OC curves |
|||||||||
|
Comparable sampling |
N and R4 |
N5 |
N6 |
||||||
|
plans |
nc |
Ac |
Re |
nc |
Ac |
Re |
nc |
Ac |
Re |
|
Single |
315 |
19 |
20 |
500 |
28 |
29 |
800 |
42 |
43 |
|
Double |
168 |
7 |
13 |
228 |
8 |
17 |
|||
|
348 |
21 |
22 |
516 |
29 |
30 |
||||
|
nc = Cumulative sample size. Ac = Acceptance number. Re = Rejection number. |
|
TIGHTENED INSPECTION PLANS—SAMPLING PLANS AND OPERATING CHARACTERISTIC (OC) CURVES FOR AQL = 4.00 DEFECTS PER HUNDRED UNITS |
|||||||||
|
[Sampling plans—AQL = 4.00] |
|||||||||
|
Identification number of OC curves |
|||||||||
|
Comparable sampling |
1 |
2 |
3 |
||||||
|
plans |
nc |
Ac |
Re |
nc |
Ac |
Re |
nc |
Ac |
Re |
|
Single |
168 |
7 |
8 |
315 |
13 |
14 |
500 |
18 |
19 |
|
Double |
120 |
3 |
7 |
168 |
5 |
10 |
228 |
5 |
11 |
|
180 |
8 |
9 |
348 |
14 |
15 |
516 |
19 |
20 |
|
Identification number of OC curves |
|||||||
|
Comparable sampling |
4 |
5 |
|||||
|
plans |
nc |
Ac |
Re |
nc |
Ac |
Re |
|
|
Single |
800 |
27 |
28 |
1,250 |
41 |
42 |
|
|
Double |
456 |
12 |
19 |
||||
|
864 |
29 |
30 |
|||||
|
nc = Cumulative sample size. Ac = Acceptance number. Re = Rejection number. |
|
REDUCED AND NORMAL INSPECTION PLANS—SAMPLING PLANS AND OPERATING CHARACTERISTIC (OC) CURVES FOR AQL=2.50 DEFECTS PER HUNDRED UNITS |
|||||||||
|
[Sampling plans—AQL=6.50] |
|||||||||
|
Identification number of OC curves |
|||||||||
|
Comparable sampling |
R1 |
N and R2 |
N and R3 |
||||||
|
plans |
nc |
Ac |
Re |
nc |
Ac |
Re |
nc |
Ac |
Re |
|
Single |
29 |
4 |
5 |
84 |
9 |
10 |
168 |
16 |
17 |
|
Double |
18 |
1 |
4 |
36 |
2 |
7 |
120 |
10 |
14 |
|
36 |
5 |
6 |
96 |
10 |
11 |
180 |
17 |
18 |
|
Identification number of OC curves |
|||||||||
|
Comparable sampling |
N and R4 |
N5 |
N6 |
||||||
|
plans |
nc |
Ac |
Re |
nc |
Ac |
Re |
nc |
Ac |
Re |
|
Single |
315 |
28 |
29 |
500 |
42 |
43 |
800 |
64 |
65 |
|
Double |
168 |
12 |
18 |
228 |
15 |
24 |
|||
|
348 |
31 |
32 |
516 |
43 |
44 |
||||
|
nc=Cumulative sample size. Ac=Acceptance number. Re=Rejection number. |
|
TIGHTENED INSPECTION PLANS—SAMPLING PLANS AND OPERATING CHARACTERISTIC (OC) CURVES FOR AQL=6.50 DEFECTS PER HUNDRED UNITS |
|||||||||
|
[Sampling plans—AQL=6.50] |
|||||||||
|
Identification number of OC curves |
|||||||||
|
Comparable sampling |
1 |
2 |
3 |
||||||
|
plans |
nc |
Ac |
Re |
nc |
Ac |
Re |
nc |
Ac |
Re |
|
Single |
168 |
11 |
12 |
315 |
19 |
20 |
500 |
28 |
29 |
|
Double |
120 |
6 |
10 |
168 |
7 |
13 |
228 |
8 |
17 |
|
180 |
12 |
13 |
348 |
21 |
22 |
516 |
29 |
30 |
|
Identification number of OC curves |
||||||
|
Comparable sampling |
4 |
5 |
||||
|
plans |
nc |
Ac |
Re |
nc |
Ac |
Re |
|
Single |
800 |
42 |
43 |
1,250 |
63 |
64 |
|
Double |
456 |
21 |
28 |
|||
|
864 |
44 |
45 |
||||
|
nc=Cumulative sample size. Ac=Acceptance number. Re=Rejection number. |
|
REDUCED AND NORMAL INSPECTION PLANS—SAMPLING PLANS AND OPERATING CHARACTERISTIC (OC) CURVES FOR AQL=10.00 DEFECTS PER HUNDRED UNITS |
|||||||||
|
[Sampling plans—AQL=10.00] |
|||||||||
|
Identification number of OC curves |
|||||||||
|
Comparable sampling |
R1 |
N and R2 |
N and R3 |
||||||
|
plans |
nc |
Ac |
Re |
nc |
Ac |
Re |
nc |
Ac |
Re |
|
Single |
29 |
5 |
6 |
84 |
13 |
14 |
168 |
23 |
24 |
|
Double |
18 |
2 |
5 |
36 |
3 |
9 |
120 |
14 |
19 |
|
36 |
6 |
7 |
96 |
15 |
16 |
180 |
25 |
26 |
|
Identification number of OC curves |
|||||||||
|
Comparable sampling |
N and R4 |
N5 |
N6 |
||||||
|
plans |
nc |
Ac |
Re |
nc |
Ac |
Re |
nc |
Ac |
Re |
|
Single |
315 |
41 |
42 |
500 |
62 |
63 |
800 |
95 |
96 |
|
Double |
168 |
19 |
26 |
228 |
23 |
34 |
|||
|
348 |
45 |
46 |
516 |
64 |
65 |
||||
|
nc = Cumulative sample size. Ac = Acceptance number. Re = Rejection number. |
|
TIGHTENED INSPECTION PLANS—SAMPLING PLANS AND OPERATING CHARACTERISTIC (OC) CURVES FOR AQL = 10.00 DEFECTS PER HUNDRED UNITS |
|||||||||
|
[Sampling plans—AQL = 10.00] |
|||||||||
|
Identification number of OC curves |
|||||||||
|
Comparable sampling |
1 |
2 |
3 |
||||||
|
plans |
nc |
Ac |
Re |
nc |
Ac |
Re |
nc |
Ac |
Re |
|
Single |
168 |
16 |
17 |
315 |
28 |
29 |
500 |
42 |
43 |
|
Double |
120 |
10 |
14 |
168 |
12 |
18 |
228 |
15 |
24 |
|
180 |
17 |
18 |
348 |
31 |
32 |
516 |
43 |
44 |
|
Identification number of OC curves |
||||||
|
Comparable sampling |
4 |
5 |
||||
|
plans |
nc |
Ac |
Re |
nc |
Ac |
Re |
|
Single |
800 |
64 |
65 |
1,250 |
96 |
97 |
|
Double |
456 |
32 |
41 |
|||
|
864 |
69 |
70 |
||||
|
nc = Cumulative sampling size. Ac = Acceptance number. Re = Rejection number. |
Cite this article: FindLaw.com - Code of Federal Regulations Title 7. Agriculture § 7.42.140 Operating Characteristic (OC) curves for on-line sampling and inspection - last updated January 02, 2025 | https://codes.findlaw.com/cfr/title-7-agriculture/cfr-sect-7-42-140/
FindLaw Codes may not reflect the most recent version of the law in your jurisdiction. Please verify the status of the code you are researching with the state legislature before relying on it for your legal needs.
Get help with your legal needs
FindLaw’s Learn About the Law features thousands of informational articles to help you understand your options. And if you’re ready to hire an attorney, find one in your area who can help.
