Learn About The Law
Get help with your legal needs
FindLaw’s Learn About the Law features thousands of informational articles to help you understand your options. And if you’re ready to hire an attorney, find one in your area who can help.
Current as of January 02, 2025 | Updated by Findlaw Staff
ABC Corporation has a home office that controls three operating divisions (Business Units A, B & C). The home office includes an administrative computer center whose costs are allocated separately to the business units. The separate allocation conforms to the requirements specified in the Cost Accounting Standard No. 403. Tables I through VI deal with home office expense allocations to business units.
The A Division is a business unit as defined by the CASB, and it uses one engineering and one manufacturing overhead pool to accumulate costs for charging overhead to final cost objectives. In addition, the indirect cost allocation process also uses two “service centers” with their own indirect cost pools: Occupancy and technical computer center.
The costs accumulated in the occupancy pool are allocated among manufacturing overhead, engineering overhead, and the technical computer center on the basis of floor space occupied. The costs accumulated in the technical computer center cost pool are allocated to users on the basis of a CPU hourly rate. Some of these allocations are made to engineering or manufacturing overhead while others are allocated direct to final cost objectives.
At the business unit level, all the indirect expense incurred is regarded either as an engineering or manufacturing expense. Thus the sole item that enters into the business unit G&A expense pool is the allocation received by the A Division from the home office.
Operating results for the A Division are given in Table VII. Facilities capital items for the division are given in Table IX.
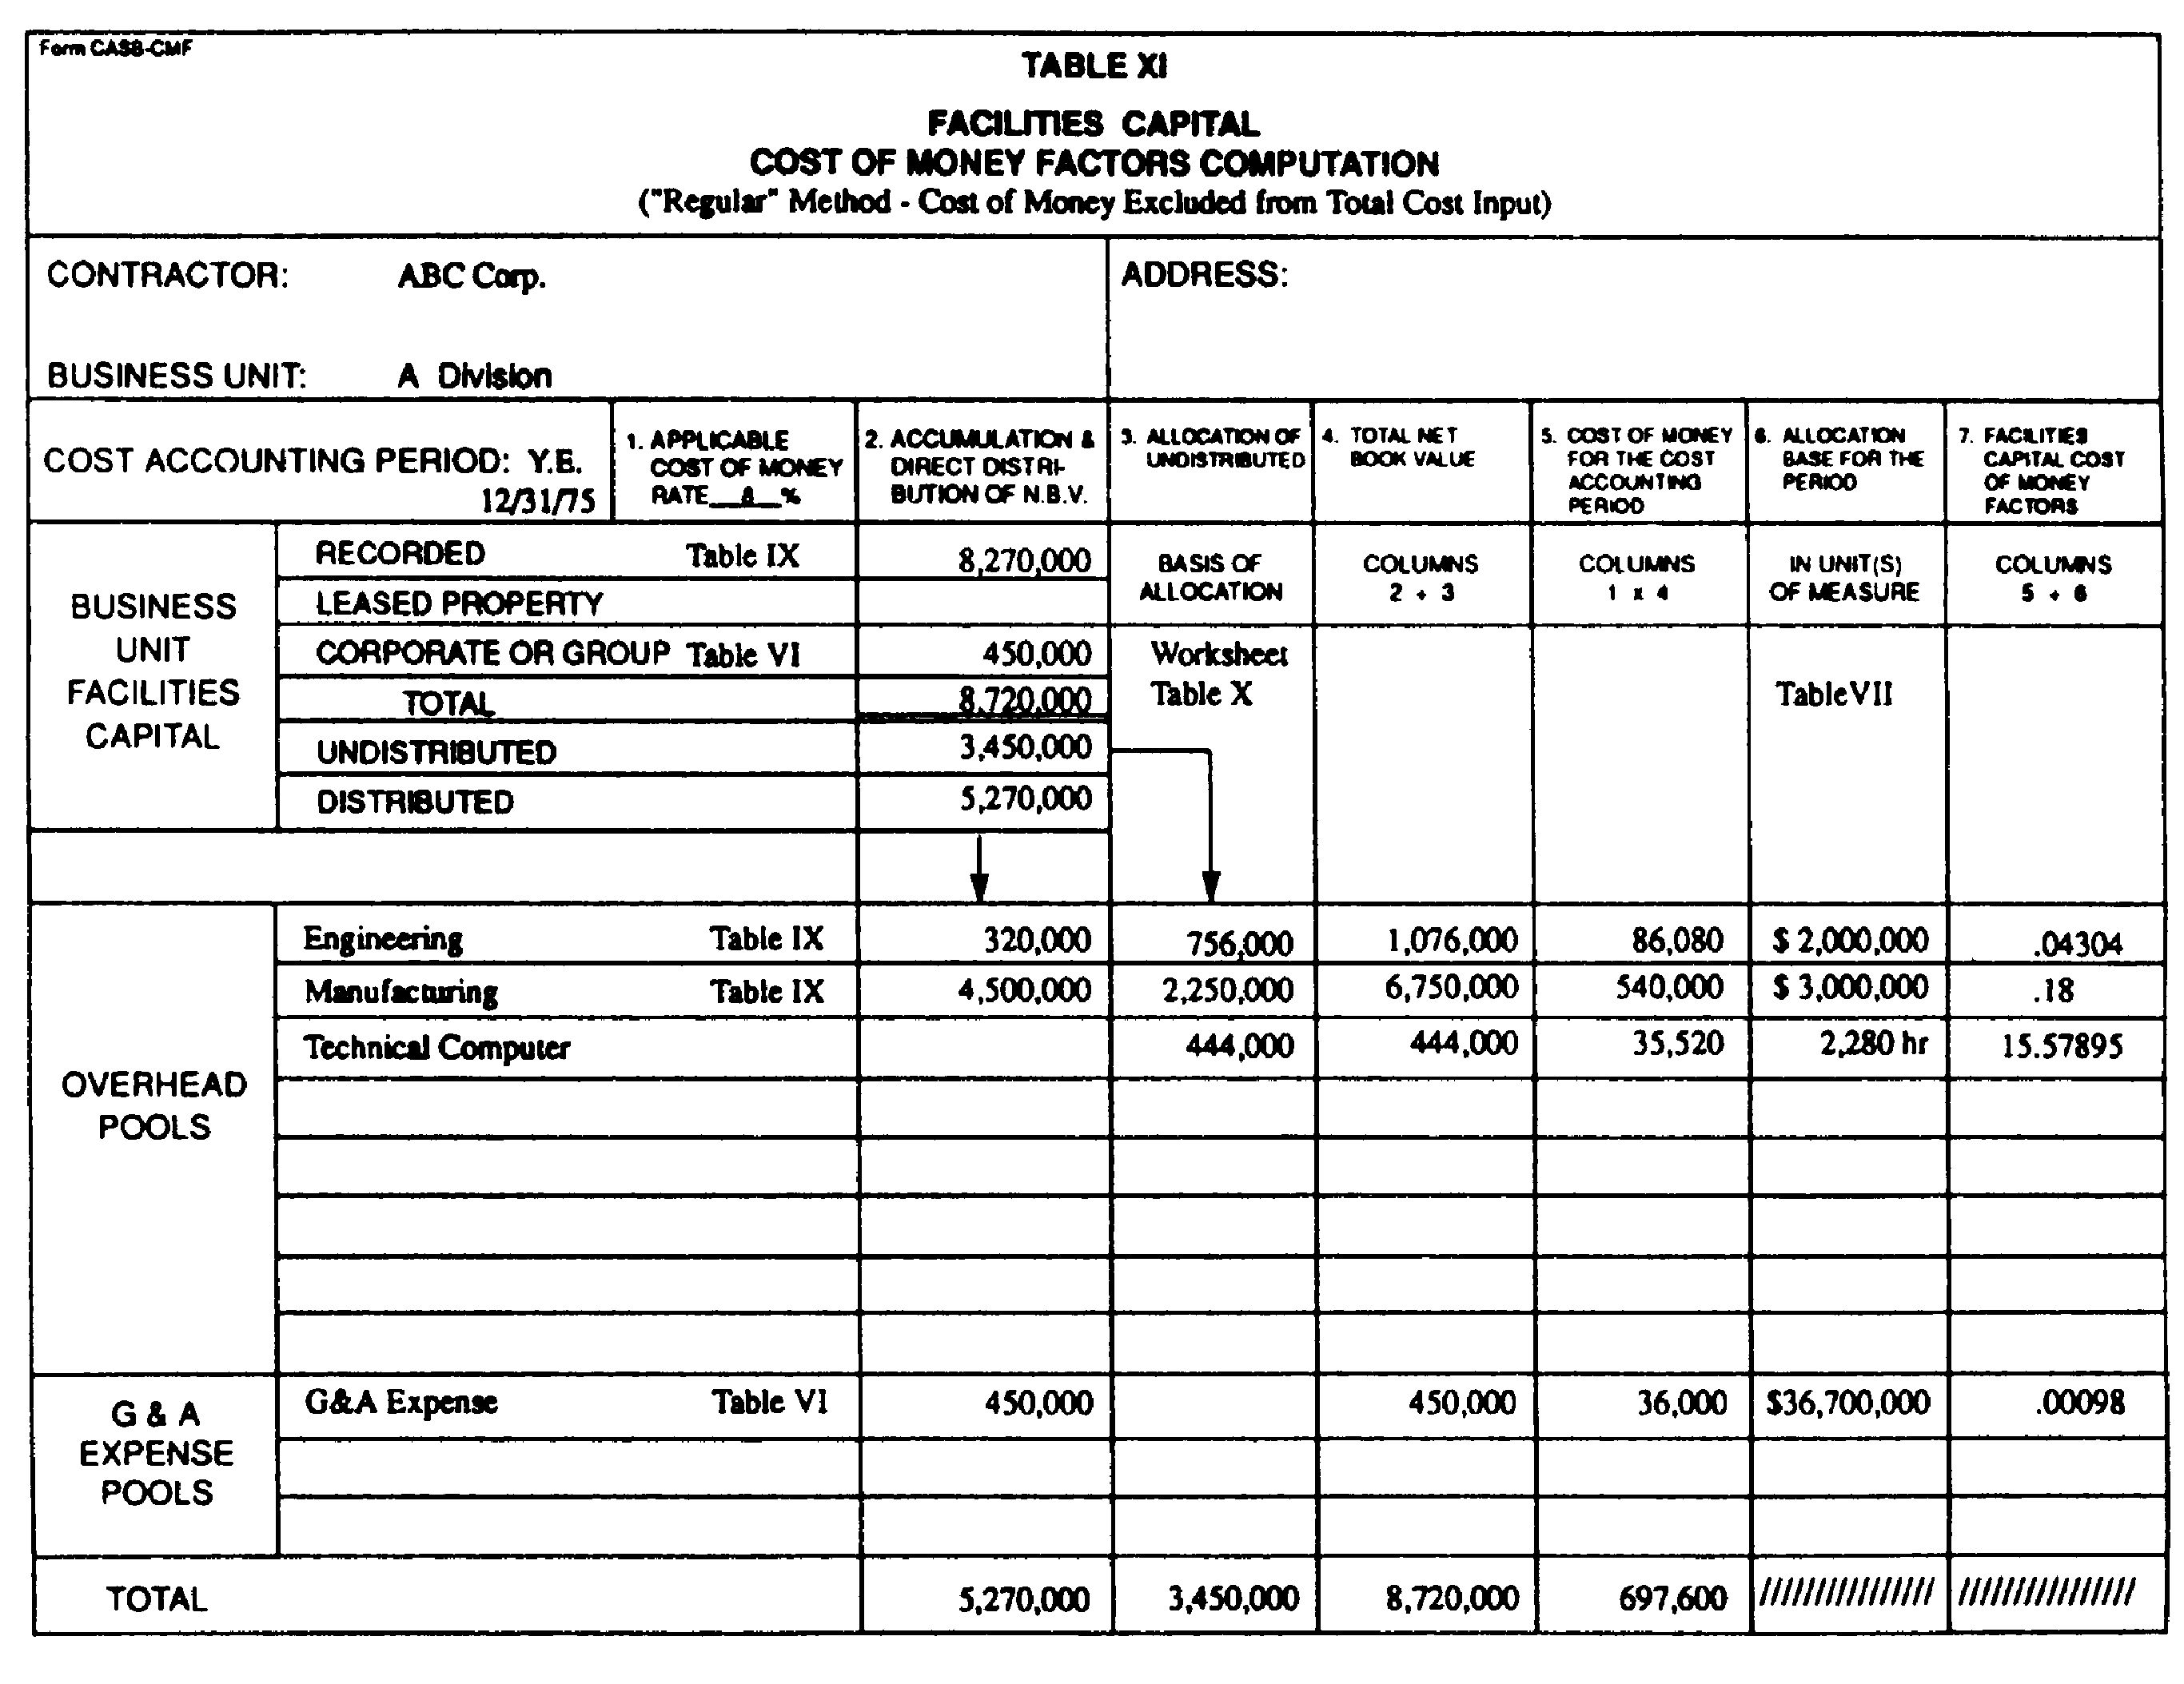
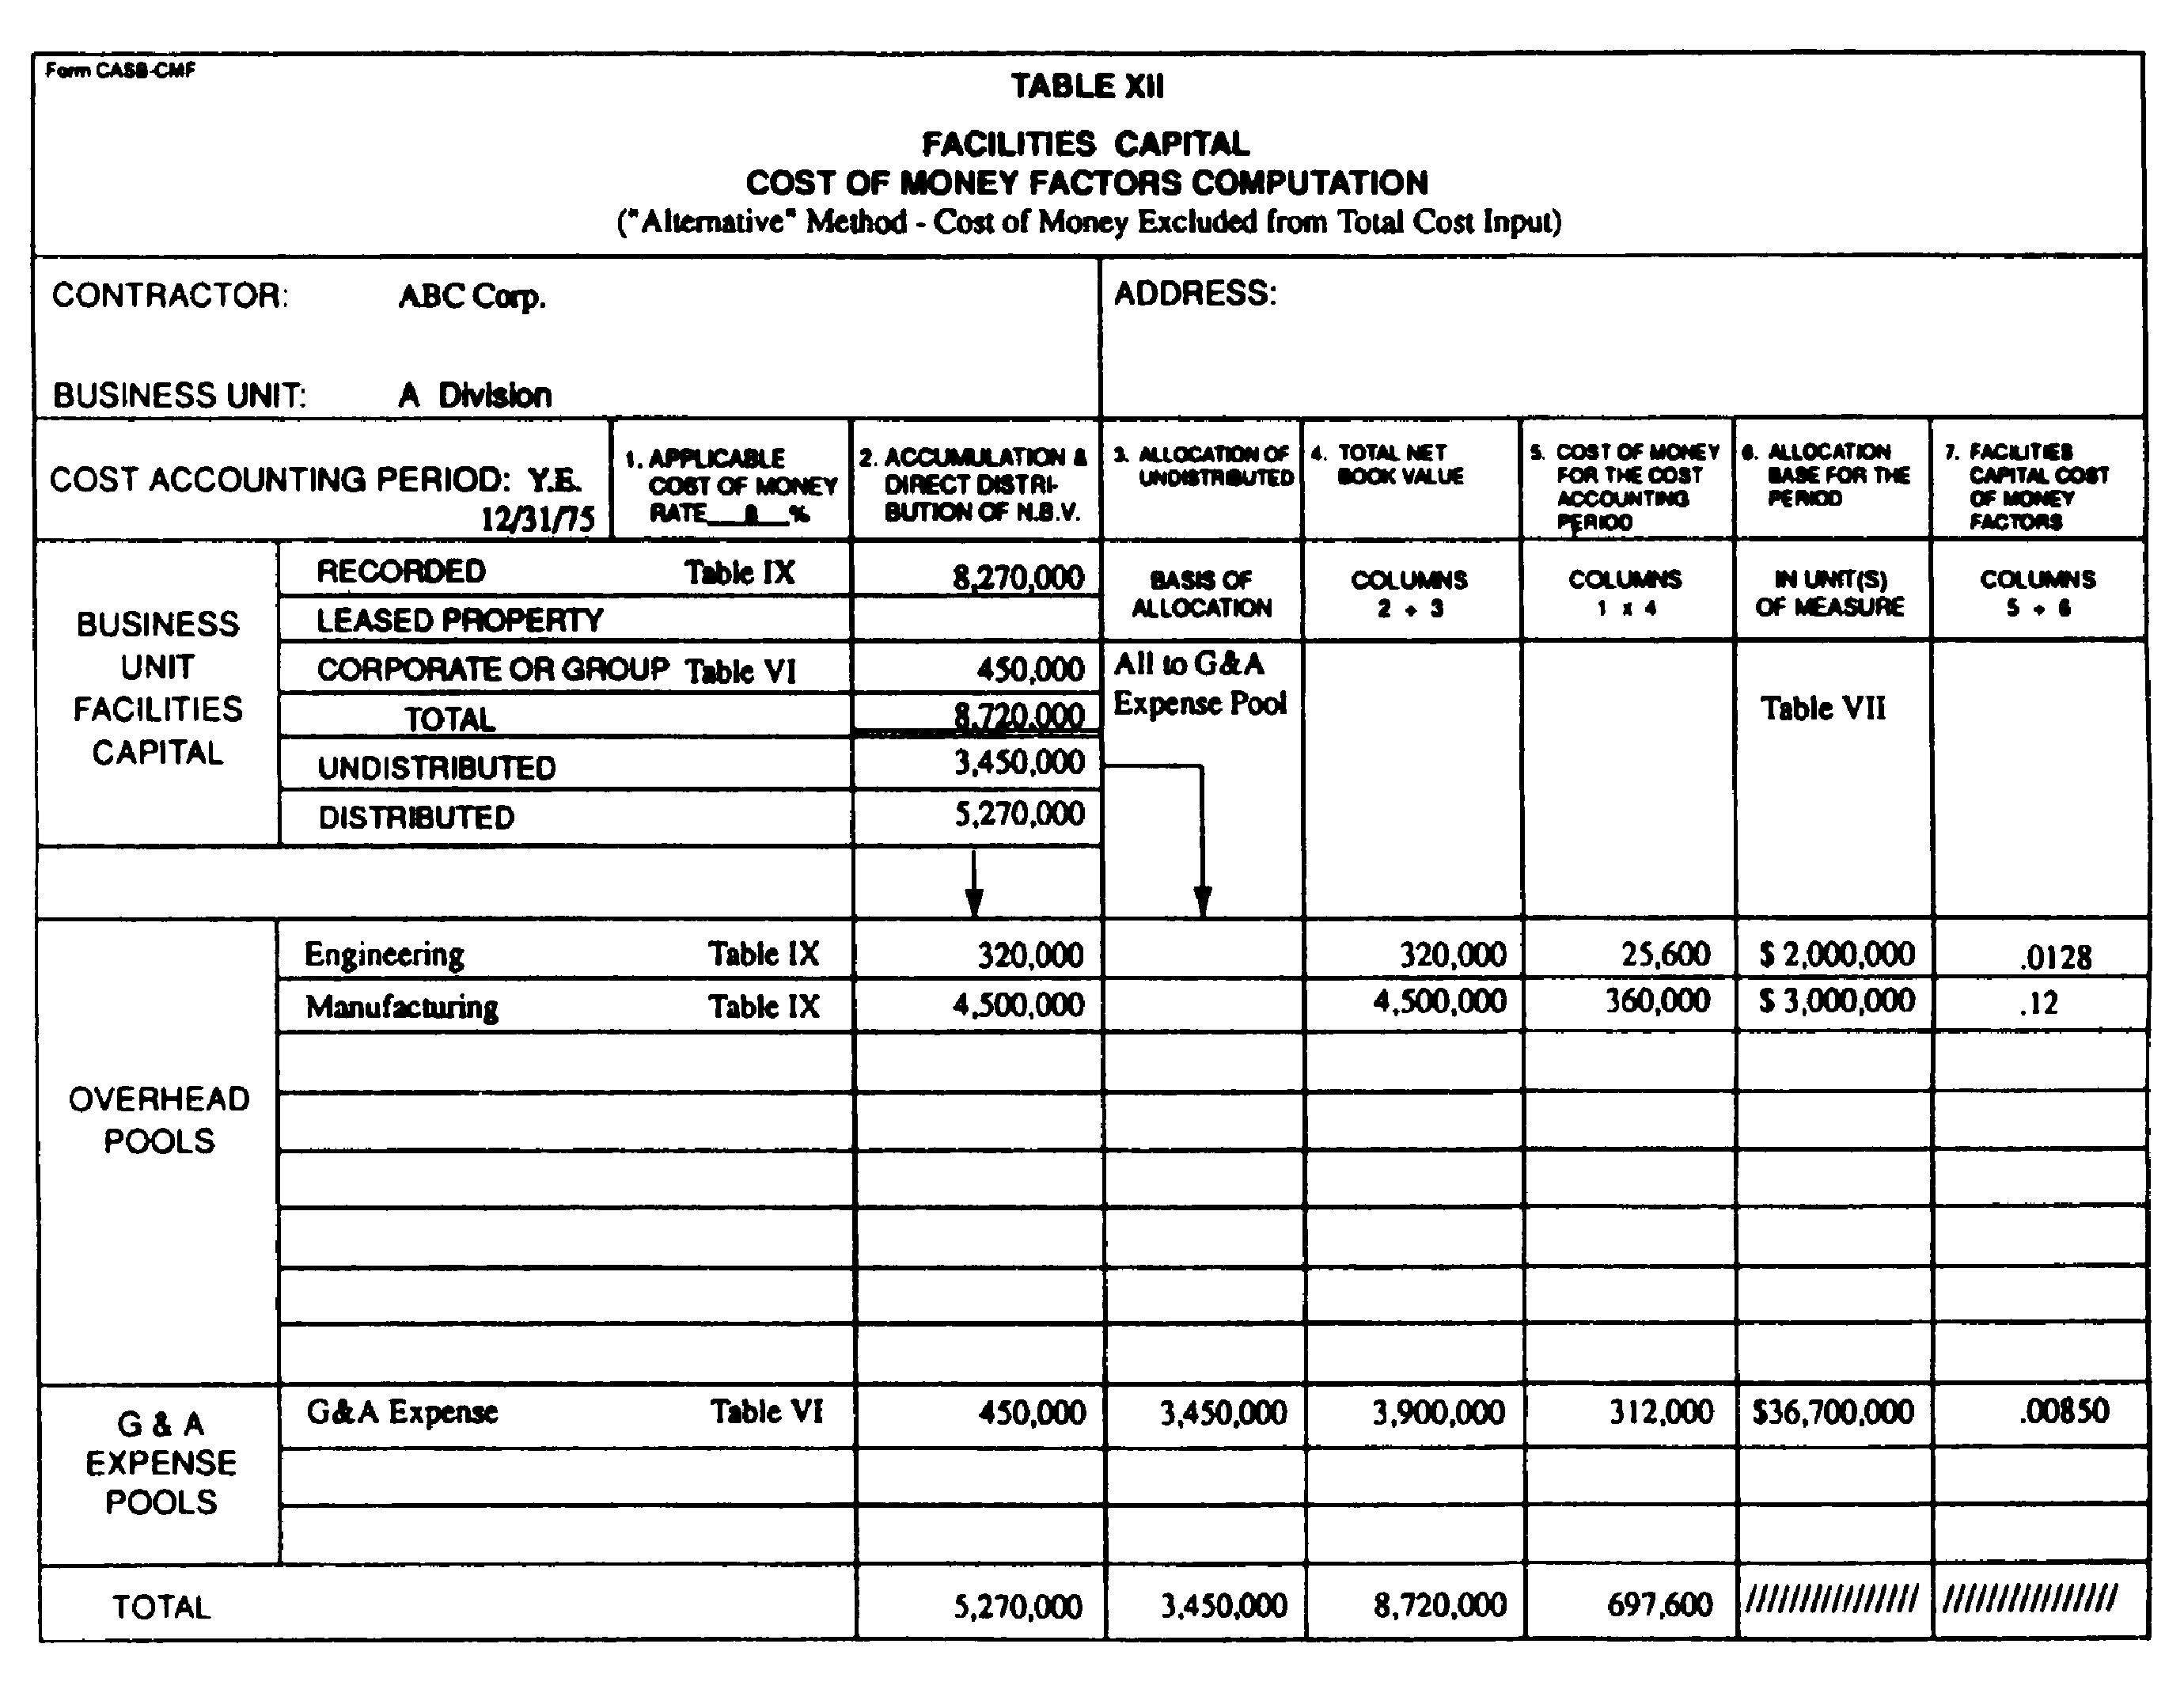
The example is based on a single set of illustrative contract cost data given in Table VIII. Since two methods, the “regular” and the “alternative” method, are potentially available for computing cost of money on facilities capital items two sets of different results can be considered.
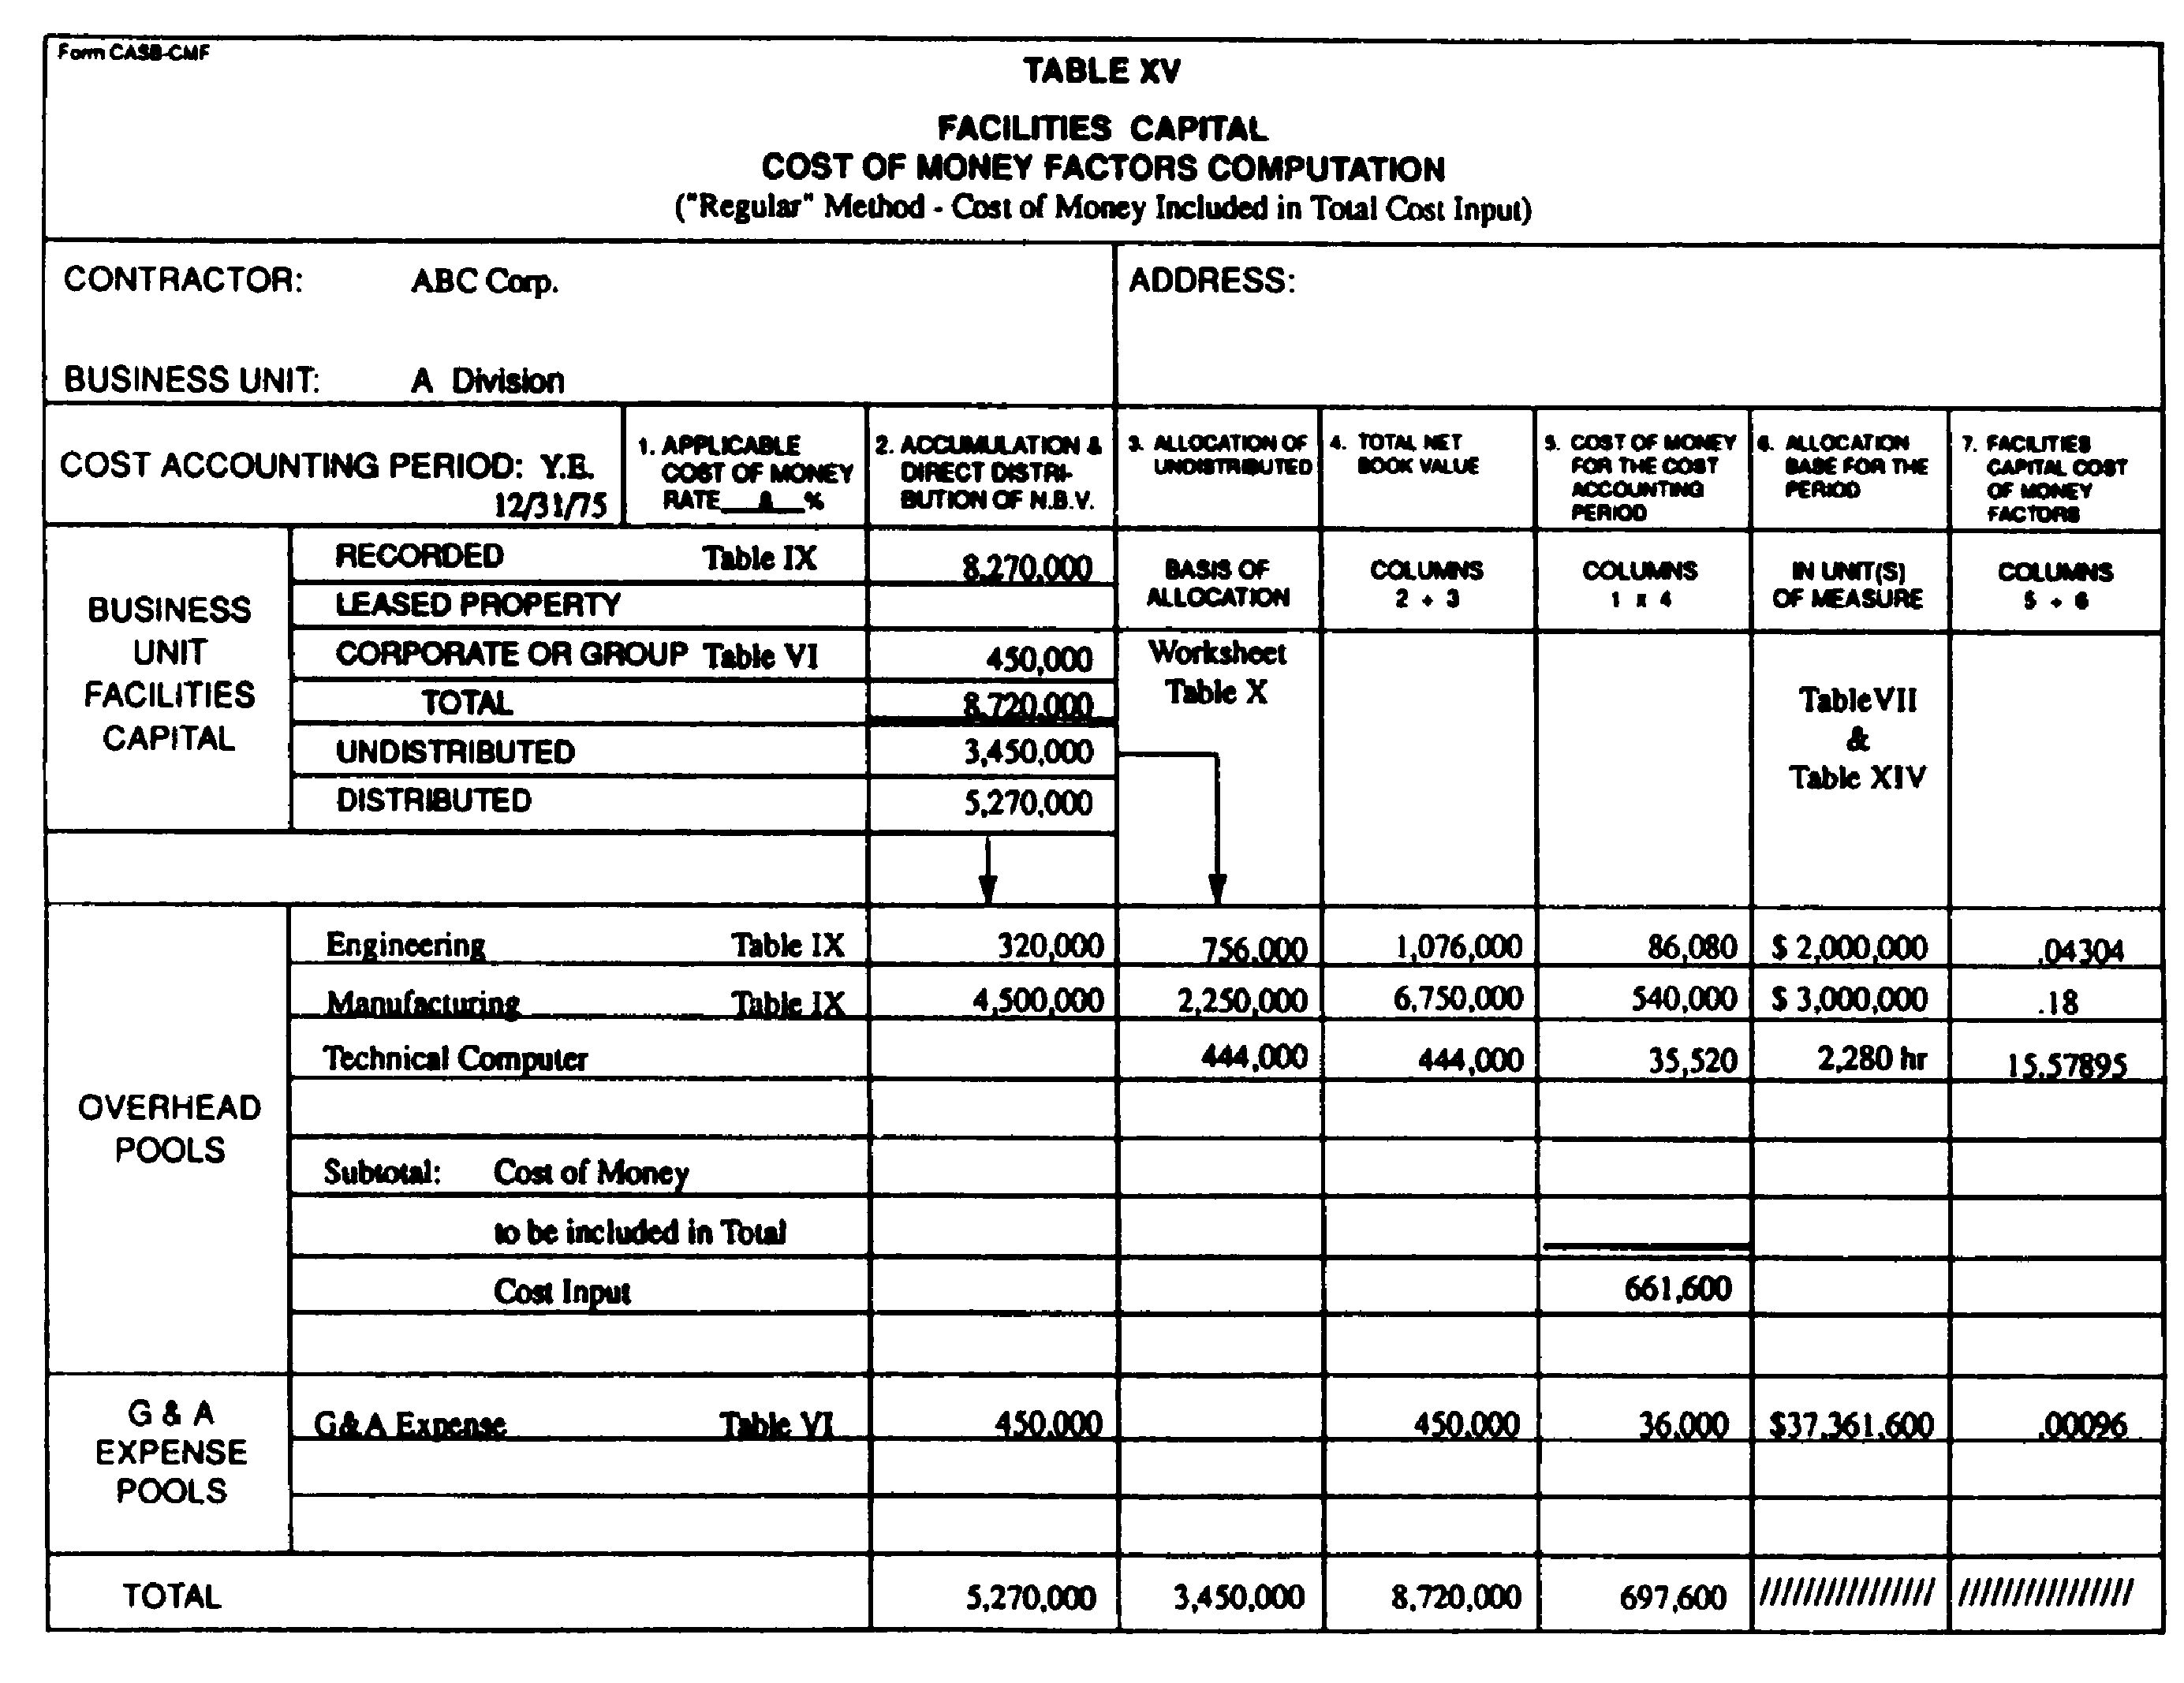
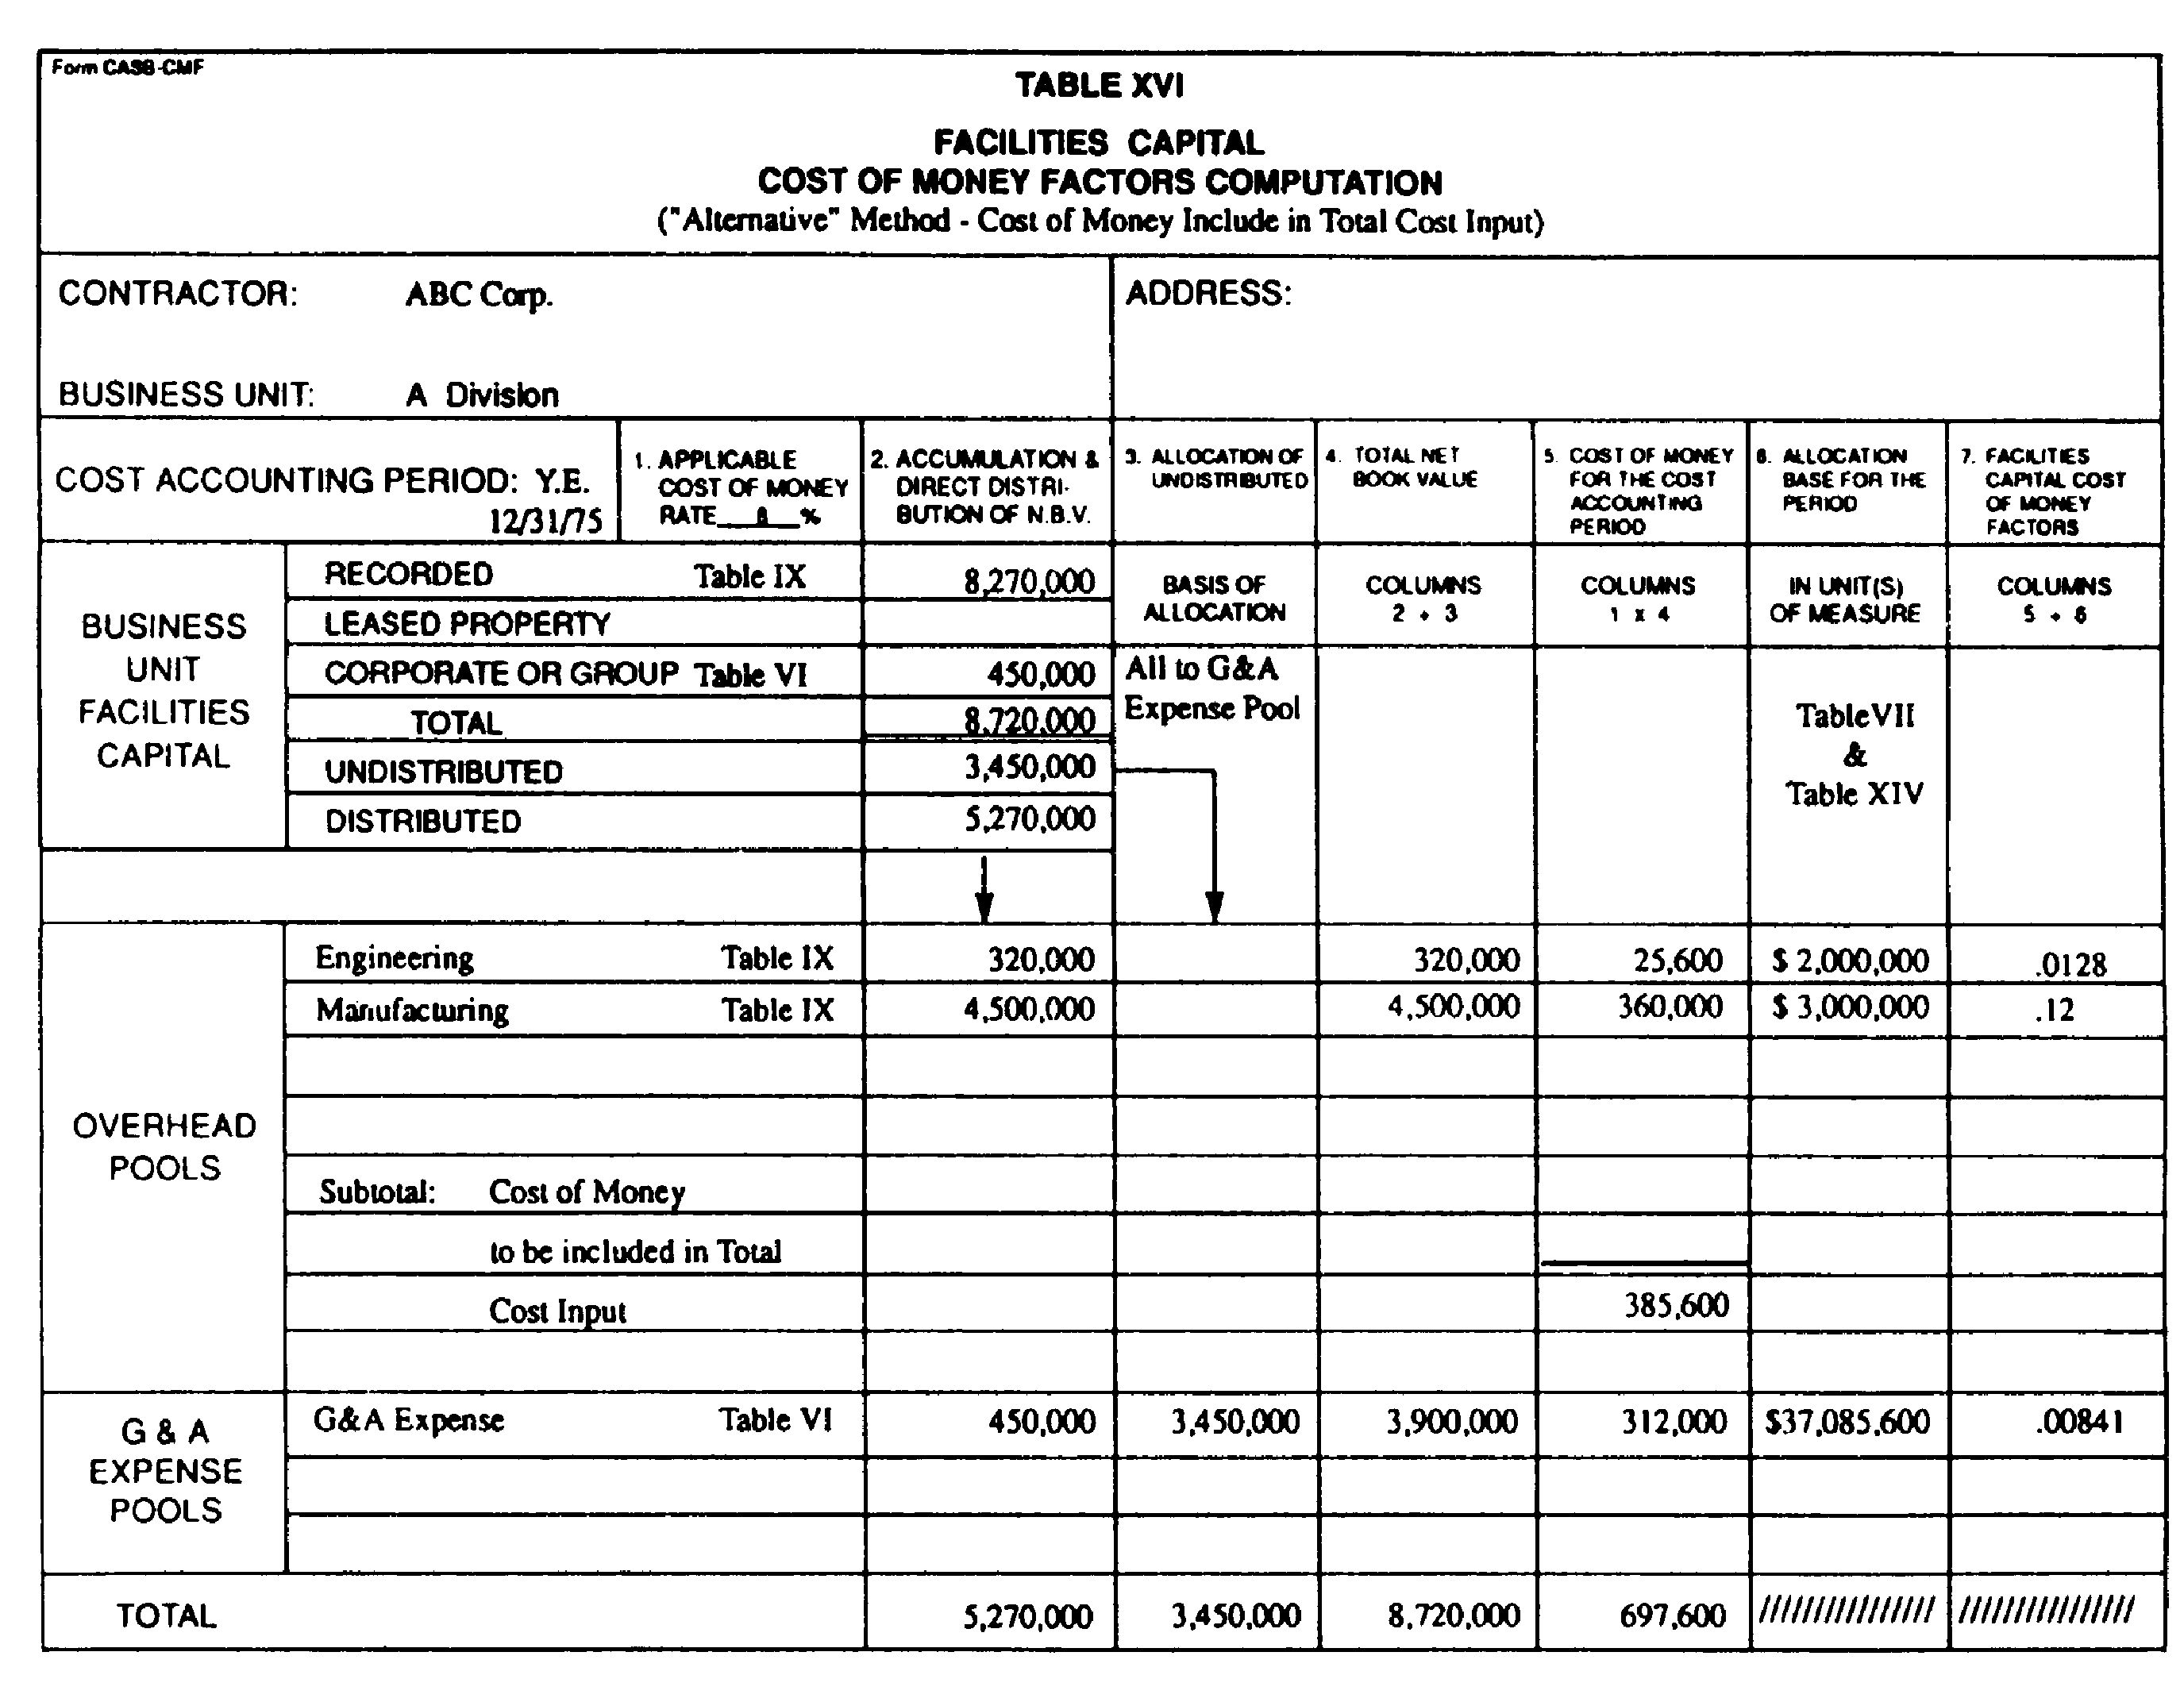
In addition, total cost input is used in the example as the allocation base for the G&A expense. Two variations of this example have been prepared to illustrate the impact of excluding or including cost of money from total cost input. Variation I, summarized in Table XIII, excludes cost of money from the cost input allocation base. Variation II, summarized in Tables XVII and XVIII, includes cost of money in the cost input allocation base.
Throughout the example, where appropriate, cross references have been made to the text of the relevant parts of the Standard.
|
Variation I—Total Cost Input Allocation
Base Excludes Cost of Money
|
||
|---|---|---|
|
Table I—Net Book Value of Home
Office Facilities Capital
|
||
|
Dec. 31, 1974 |
Dec. 31, 1975 |
|
|
Administrative computer center facilities capital |
$550,000 |
$450,000 |
|
Other home office facilities capital․․․․․․․․․․․․․ |
420,000 |
380,000 |
|
Total․․․․․․․․․․․․․․․․․․․․․․․․․․․․․․․․․․․․․․․․․․․․ |
970,000 |
830,000 |
The assets in the above table generate allowable depreciation or amortization, as explained in Instructions for Form CASB CMF (Basis). Thus they should be included in the asset base for cost of money computation.
|
Table II—Home Office Facilities
Capital Annual Average Balances
|
||
|---|---|---|
|
Administrative computer center facilities capital․․․․․․․․․․․․․․․․․․․․․․․․․․․․․․․ |
$500,000 |
|
|
Other home office facilities capital․․․․․․․․․․․․․․․․․․․․․․․․․․․․․․․․․․․․․․․․․․․․ |
400,000 |
|
|
Total․․․․․․․․․․․․․․․․․․․․․․․․․․․․․․․․․․․․․․․․․․․․․․․․․․․․․․․․․․․․․․․․ |
900,000 |
The above averages are based on data in Table I computed in accordance with the criteria in Instructions for Form CASB CMF (Recorded, Leased Property, Corporate).
$970,000+$830,000=$1,800,00012=$900,000
|
Table III—Home Office Depreciation
and Amortization for 1975
|
||
|---|---|---|
|
Administrative computer center facilities capital․․․․․․․․․․․․․․․․․․․․․․․․․․․․․․․ |
$100,000 |
|
|
Other home office facilities capital․․․․․․․․․․․․․․․․․․․․․․․․․․․․․․․․․․․․․․․․․․․․ |
40,000 |
|
|
Total․․․․․․․․․․․․․․․․․․․․․․․․․․․․․․․․․․․․․․․․․․․․․․․․․․․․․․․․․․․․․․․․ |
140,000 |
|
Table IV—Allocation of ABC Home Office
Expenses to Divisions (Business Units)
|
|||||
|---|---|---|---|---|---|
|
Allocation of business units |
|||||
|
Total expense
|
A |
B |
C |
||
|
Administrative computer center․․․․․․․․․․․․․․․․․․․․ |
$1,800,000 |
$900,000 |
$900,000 |
||
|
Other home office․․․․․․․․․․․․․․․․․․․․․․․․․․․․․․․․․ |
4,800,000 |
2,400,000 |
1,200,000 |
1,200,000 |
|
|
Total․․․․․․․․․․․․․․․․․․․․․․․․․․․․․․․․․․․․ |
6,600,000 |
3,300,000 |
2,100,000 |
1,200,000 |
The above allocation is carried out in accordance with CAS 403. The expense allocated to individual business units above includes depreciation and amortization as reflected in Table V.
|
Table V—Depreciation and Amortization Component
of ABC Home Office Expense
|
|||||
|---|---|---|---|---|---|
|
Allocation of business units |
|||||
|
Total depreciation and amortization expense |
A |
B |
C |
||
|
Administrative computer center․․․․․․․․․․․․․․․․․․․․ |
$100,000 |
$50,000 |
$50,000 |
||
|
Other home office․․․․․․․․․․․․․․․․․․․․․․․․․․․․․․․․․ |
40,000 |
20,000 |
10,000 |
10,000 |
|
|
Total․․․․․․․․․․․․․․․․․․․․․․․․․․․․․․․․․․․․ |
140,000 |
70,000 |
60,000 |
10,000 |
Table VI—Allocation of Home Office Facilities Capital to Business Units
(a) Depreciation and amortization allocation in Table V converted to percentages.
|
Allocation of business units (in percent) |
||||
|---|---|---|---|---|
|
Total depreciation and amortization expense (in percent) |
A |
B |
C |
|
|
Administrative computer center․․․․․ |
100 |
50 |
50 |
|
|
Other home office․․․․․․․․․․․․․․․․․․ |
100 |
50 |
25 |
25 |
(b) Application of percentages in (a) to average net book values in Table II, in accordance with criteria in Instructions for Form CASB CMF (Recorded, Leased Property, Corporate).
|
Allocation of business units |
|||||
|---|---|---|---|---|---|
|
Total net book value |
A |
B |
C |
||
|
Administrative computer center facilities capital․ |
$500,000 |
$250,000 |
$250,000 |
||
|
Other home office facilities capital․․․․․․․․․․․․․․ |
400,000 |
200,000 |
100,000 |
$100,000 |
|
|
Total․․․․․․․․․․․․․․․․․․․․․․․․․․․․․․․․․․․․ |
900,000 |
450,000 |
350,000 |
100,000 |
|
Table VII—“A” Division 1975 Operating Results |
||||||
|---|---|---|---|---|---|---|
|
Total cost
input and
other work
G.&A.
|
Fixed-price
CAS-covered
contract
|
Cost reim-
bursement
CAS-covered
contracts
|
Commercial
and other
work
|
|||
|
Direct material: |
||||||
|
Purchased parts․․․․․․․․․․․․․․․․․․․․․․․․․․․․ |
$2,000,000 |
$100,000 |
$100,000 |
$1,800,000 |
||
|
Subcontract items․․․․․․․․․․․․․․․․․․․․․․․․․․ |
21,530,000 |
11,750,000 |
7,205,000 |
2,575,000 |
||
|
Total․․․․․․․․․․․․․․․․․․․․․․․․․․․․․․․․․․ |
23,530,000 |
11,850,000 |
7,305,000 |
4,375,000 |
||
|
Director labor and overhead: |
||||||
|
Engineering labor․․․․․․․․․․․․․․․․․․․․․․․․․․ |
2,000,000 |
1,500,000 |
500,000 |
|||
|
Engineering overhead (80 pct of direct engineering labor) |
1,600,000 |
1,200,000 |
400,000 |
|||
|
Manufacturing labor․․․․․․․․․․․․․․․․․․․․․․․․ |
3,000,000 |
1,200,000 |
200,000 |
1,600,000 |
||
|
Manufacturing overhead (200 pct of direct management labor) |
6,000,000 |
2,400,000 |
400,000 |
3,200,000 |
||
|
Other direct charges: |
||||||
|
Technical computer center direct charge 2,280 h at $250/h |
570,000 |
200,000 |
370,000 |
|||
|
Total cost input (excluding cost of money) |
36,700,000 |
18,350,000 |
9,175,000 |
9,175,000 |
||
|
G. & A. (8.99 pct of cost input)․․․․․․․․․․․․․․․․․․ |
3,300,000 |
1,650,000 |
825,000 |
825,000 |
||
|
Total․․․․․․․․․․․․․․․․․․․․․․․․․․․․․․․․․․ |
40,000,000 |
20,000,000 |
10,000,000 |
10,000,000 |
|
Table VIII—Cost Data for the Contract |
||
|---|---|---|
|
Purchased parts․․․․․․․․․․․․․․․․․․․․․․․․․․․․․․․․․․․․․․․․․․․․․․․․․․․․․․․․․․․․ |
$85,000 |
|
|
Subcontract items․․․․․․․․․․․․․․․․․․․․․․․․․․․․․․․․․․․․․․․․․․․․․․․․․․․․․․․․․․ |
990,000 |
|
|
Technical computer time 280 h at $250/h․․․․․․․․․․․․․․․․․․․․․․․․․․․․․․․․․․․․ |
70,000 |
|
|
Engineering labor․․․․․․․․․․․․․․․․․․․․․․․․․․․․․․․․․․․․․․․․․․․․․․․․․․․․․․․․․․ |
330,000 |
|
|
Engineering overhead at 80 pct․․․․․․․․․․․․․․․․․․․․․․․․․․․․․․․․․․․․․․․․․․․․․ |
264,000 |
|
|
Manufacturing labor․․․․․․․․․․․․․․․․․․․․․․․․․․․․․․․․․․․․․․․․․․․․․․․․․․․․․․․․ |
1,210,000 |
|
|
Manufacturing overhead at 200 pct․․․․․․․․․․․․․․․․․․․․․․․․․․․․․․․․․․․․․․․․․․ |
2,420,000 |
|
|
Total cost input (excluding cost of money)․․․․․․․․․․․․․․․․․․․․․․․․․․ |
5,369,000 |
|
|
G & A. at 8.99 pct․․․․․․․․․․․․․․․․․․․․․․․․․․․․․․․․․․․․․․․․․․․․․․․․․․․․․․․․․ |
483,000 |
|
|
Total cost input and G. & A. (excluding cost of money)․․․․․․․․․․․․․․ |
5,852,000 |
Table IX—Division A Facilities Capital
Average net book values are computed in accordance with Instructions to Form CASB CMF. Average figures only are given, the underlying beginning and ending balances for 1975 have not been reproduced.
|
Name of indirect cost pool the asset is associated with |
Average net book value |
Annual depreciation |
|
|---|---|---|---|
|
Engineering overhead․․․․․․․․․․․․․․․․․․․․․․․․․․․․․․․․․․․․․․․ |
$320,000 |
$40,000 |
|
|
Manufacturing overhead․․․․․․․․․․․․․․․․․․․․․․․․․․․․․․․․․․․․․ |
4,500,000 |
900,000 |
|
|
Technical computer center․․․․․․․․․․․․․․․․․․․․․․․․․․․․․․․․․․ |
450,000 |
90,000 |
|
|
Occupancy․․․․․․․․․․․․․․․․․․․․․․․․․․․․․․․․․․․․․․․․․․․․․․․․․․ |
3,000,000 |
200,000 |
|
|
Facilities capital recorded by division A (see Form CASB CMF instructions for description of recorded) |
8,270,000 |
1,230,000 |
|
|
Allocated from home office, table VI․․․․․․․․․․․․․․․․․․․․․․․ |
450,000 |
||
|
Total division A․․․․․․․․․․․․․․․․․․․․․․․․․․․․․․․․․ |
8,720,000 |
Table X—Allocation of Undistributed Facilities Capital
(a) Occupancy Pool Assets. Total occupancy pool expenses are assumed to be $1,000,000 of which $200,000 is depreciation per Table IX. Allocation of the $3,000,000 net book value of assets per Table IX is performed on the basis of floor space utilization.
|
Indirect cost pool |
Occupancy
expense and
depreciation allocation
|
Percent
of total
floor space utilized
|
Asset allocation
|
|
|---|---|---|---|---|
|
Engineering․․․․․․․․․․․․․․․․․․․․․․․․․․․․․․․․․ |
$200,000 |
20 |
$600,000 |
|
|
Manufacturing․․․․․․․․․․․․․․․․․․․․․․․․․․․․․․․ |
750,000 |
75 |
2,250,000 |
|
|
Technical computer․․․․․․․․․․․․․․․․․․․․․․․․․․ |
50,000 |
5 |
150,000 |
|
|
Total․․․․․․․․․․․․․․․․․․․․․․․․․․․․․․․․․․․ |
1,000,000 |
100 |
3,000,000 |
(b) Technical Computer Center Assets. Total technical computer center expenses for the year are assumed to be $770,000 including $90,000 depreciation per Table IX and $50,000 charge from the occupancy pool per paragraph (a) of this table. A charging rate of $250 per hour is computed assuming a total of 3,080 chargeable CPU hours per annum. The net book value of assets amounting to $600,000 ($450,000 per Table IX plus the $150,000 allocated per (a) above) is allocated on the basis of CPU hours utilized.
|
Overhead pool or cost objective |
Hours
charged
|
Amount
charged
|
Percent |
Asset
allocation
|
|
|---|---|---|---|---|---|
|
Fixed price contracts, table VII․․․․․․․․․․․․․․․․․․ |
800 |
$200,000 |
26 |
$156,000 |
|
|
Cost reimbursement contracts, table VII․․․․․․․․․․․ |
1,480 |
370,000 |
48 |
288,000 |
|
|
Engineering overhead pool․․․․․․․․․․․․․․․․․․․․․․․․․ |
800 |
200,000 |
26 |
156,000 |
|
|
Total․․․․․․․․․․․․․․․․․․․․․․․․․․․․․․․․․․․․ |
3,080 |
770,000 |
100 |
600,000 |
(c) Summary of Undistributed Facilities Capital Allocation. Undistributed (per Table IX).
|
Technical computer center․․․․․․․․․․․․․․․․․․․․․․․․․․․․․․․․․․․․․․․․․․․․․․․․․․․․․․ |
$450,000 |
|
|
Occupancy․․․․․․․․․․․․․․․․․․․․․․․․․․․․․․․․․․․․․․․․․․․․․․․․․․․․․․․․․․․․․․․․․․․․․․ |
3,000,000 |
|
|
Total․․․․․․․․․․․․․․․․․․․․․․․․․․․․․․․․․․․․․․․․․․․․․․․․․․․․․․․․․․․․․․․․․ |
3,450,000
|
Distribution per paragraph (a) or (b) of this table of balances to overhead pools that result in charges direct to final cost objectives.
|
Overhead pool |
(a) |
(b) |
Total |
|
|---|---|---|---|---|
|
Engineering․․․․․․․․․․․․․․․․․․․․․․․․․․․․․․․․․ |
$600,000 |
$156,000 |
$756,000 |
|
|
Manufacturing․․․․․․․․․․․․․․․․․․․․․․․․․․․․․․․ |
2,250,000 |
․․․․․․․․․․․․․․․․․․ |
2,250,000 |
|
|
Technical computer center (direct charge to contracts) |
․․․․․․․․․․․․․․․․․․ |
444,000 |
444,000 |
|
|
Total․․․․․․․․․․․․․․․․․․․․․․․․․․․․․․ |
2,850,000 |
600,000 |
3,450,000 |
|
Table XIII—Summary of Cost of Money
Computation on Facilities Capital
|
||||||
|---|---|---|---|---|---|---|
|
[Cost of money excluded from total cost input] |
||||||
|
Allocation base |
Allocated
to contract,
table VIII
|
Computation
using regular
facilities,
capital cost
of money
factor,
table XI
|
Amount |
Computation
using
alternative
facilities
capital,
cost of
money factor,
table XI
|
Amount |
|
|
Engineering labor․․․․․․․․․․․․․․․․․․․․ |
$330,000 |
0.04304 |
$14,203 |
0.0128 |
$4,244 |
|
|
Manufacturing labor․․․․․․․․․․․․․․․․․․ |
1,210,000 |
.18 |
217,800 |
.12 |
145,200 |
|
|
Technical computer time․․․․․․․․․․․․․․ |
1280 |
15.57895 |
4,362 |
․․․․․․․․․․․․ |
․․․․․․․․․․․․ |
|
|
Cost input․․․․․․․․․․․․․․․․․․․․․․․․․․․ |
$5,369,000 |
.00098 |
5,261 |
.00850 |
45,636 |
|
|
Total cost of money on facilities capital |
․․․․․․․․․․․․ |
․․․․․․․․․․․․ |
241,626 |
․․․․․․․․․․․․ |
195,060 |
1 Hours.
|
Variation II—Total Cost Input Allocation Base Includes Cost of Money |
||
|---|---|---|
|
Table XIV—Recomputation of “A” Division Total Cost Input To
Reflect Inclusion of Cost of Money
|
||
|
(a) |
Regular method: |
|
|
Total cost input per table VII․․․․․․․․․․․․․․․․․․․․․․․․․․․․․․․․․․․․․․․․․․ |
$36,700,000 |
|
|
Cost of money applicable to facilities capital identified with overhead pools per
subtotal in column 5, table XV
|
661,600 |
|
|
Total cost input including cost of money․․․․․․․․․․․․․․․․․․․․․․․․․․․․․․ |
37,361,600 |
|
|
(b) |
Alternative method: |
|
|
Total cost input per table VII․․․․․․․․․․․․․․․․․․․․․․․․․․․․․․․․․․․․․․․․․․ |
36,700,000 |
|
|
Cost of money applicable to facilities capital identified with overhead pools per
subtotal in column 5, table XVI
|
385,600 |
|
|
Total cost input including cost of money․․․․․․․․․․․․․․․․․․․․․․․․․․․․․․ |
37,085,900 |
|
Table XVII—Summary of Cost of Money Computation on Facilities Capital |
||||
|---|---|---|---|---|
|
[Cost of money included in total cost input—regular method] |
||||
|
Allocation base |
Allocated
to contract,
table VIII
|
Computation
using regular
facilities,
capital cost
of money
factor,
table XV
|
Amount |
|
|
Engineering labor․․․․․․․․․․․․․․․․․․․․․․․․․․․ |
$330,000 |
0.04304 |
$14,203 |
|
|
Manufacturing labor․․․․․․․․․․․․․․․․․․․․․․․․․ |
1,210,000 |
.18 |
217,800 |
|
|
Technical computer time․․․․․․․․․․․․․․․․․․․․․ |
1 280 |
15.57895 |
4,362 |
|
|
Cost of money related to overheads․․․․․․․․․․ |
․․․․․․․․․․․․․․․․․․ |
․․․․․․․․․․․․․․․․․․ |
236,365 |
|
|
Cost of money above to be included in cost input |
236,365 |
․․․․․․․․․․․․․․․․․․ |
․․․․․․․․․․․․․․․․․․ |
|
|
Cost input, table VIII․․․․․․․․․․․․․․․․․․․․․․ |
5,369,000 |
․․․․․․․․․․․․․․․․․․ |
․․․․․․․․․․․․․․․․․․ |
|
|
Cost input including cost of money․․․․․․․․․․ |
5,605,365 |
.00096 |
5,381 |
|
|
Total cost of money on facilities capital |
․․․․․․․․․․․․․․․․․․ |
․․․․․․․․․․․․․․․․․․ |
241,674 |
1 Hours.
|
Table XVIII—Summary of Cost of Money Computation on Facilities Capital |
||||
|---|---|---|---|---|
|
[Cost of money included in total cost input—alternative method] |
||||
|
Allocation base |
Allocated
to contract,
table VIII
|
Computation
using
alternative
facilities,
capital cost
of money
factor,
table XVI
|
Amount |
|
|
Engineering labor․․․․․․․․․․․․․․․․․․․․․․․․․․․ |
$330,000 |
0.0128 |
$4,224 |
|
|
Manufacturing labor․․․․․․․․․․․․․․․․․․․․․․․․․ |
1,210,000 |
.12 |
145,200 |
|
|
Cost of money related to overheads․․․․․․․․․․ |
․․․․․․․․․․․․․․․․․․ |
․․․․․․․․․․․․․․․․․․ |
149,424 |
|
|
Cost of money above to be included in cost input |
149,424 |
․․․․․․․․․․․․․․․․․․ |
․․․․․․․․․․․․․․․․․․ |
|
|
Cost input, table VIII․․․․․․․․․․․․․․․․․․․․․․ |
5,369,000 |
․․․․․․․․․․․․․․․․․․ |
․․․․․․․․․․․․․․․․․․ |
|
|
Cost input including cost of money․․․․․․․․․․ |
5,518,424 |
.00841 |
46,410 |
|
|
Total cost of money on facilities capital |
5,518,424 |
․․․․․․․․․․․․․․․․․․ |
195,834 |
Cite this article: FindLaw.com - Code of Federal Regulations Title 48. Federal Acquisition Regulations System 48.904.414, App. B Appendix B to 9904.414—Example—ABC Corporation - last updated January 02, 2025 | https://codes.findlaw.com/cfr/title-48-federal-acquisition-regulations-system/cfr-48-9904-414-app-b/
FindLaw Codes may not reflect the most recent version of the law in your jurisdiction. Please verify the status of the code you are researching with the state legislature before relying on it for your legal needs.
Get help with your legal needs
FindLaw’s Learn About the Law features thousands of informational articles to help you understand your options. And if you’re ready to hire an attorney, find one in your area who can help.
